 2
2peptides
spectra
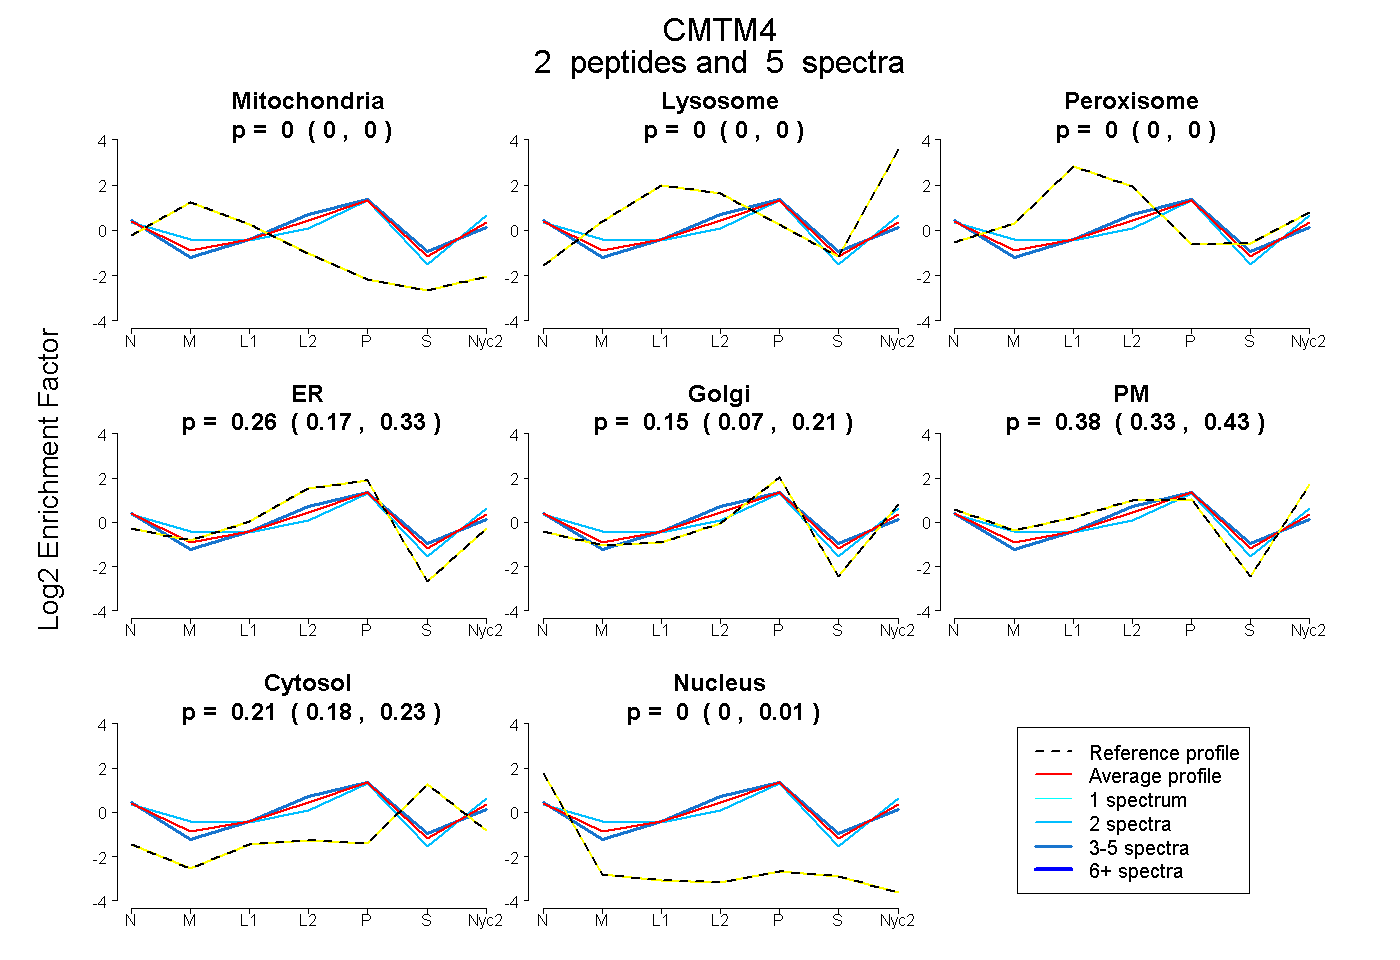
0.000 | 0.000
0.000 | 0.000
0.000 | 0.000
0.172 | 0.327
0.072 | 0.209
0.328 | 0.428
0.176 | 0.234
0.000 | 0.013
| Plot | Mito | Lyso | Perox | ER | Golgi | PM | Cytosol | Nucleus | |||||
| Expt A |
2 peptides |
5 spectra |
|
0.000 0.000 | 0.000 |
0.000 0.000 | 0.000 |
0.000 0.000 | 0.000 |
0.257 0.172 | 0.327 |
0.152 0.072 | 0.209 |
0.379 0.328 | 0.428 |
0.212 0.176 | 0.234 |
0.000 0.000 | 0.013 |
| 2 spectra, QQSANDYIR | 0.057 | 0.000 | 0.006 | 0.000 | 0.393 | 0.425 | 0.119 | 0.000 | ||
| 3 spectra, DVDGRPEIQR | 0.000 | 0.000 | 0.000 | 0.406 | 0.025 | 0.317 | 0.253 | 0.000 |
| Plot | Lyso | Other | |||||||||||
| Expt C |
3 peptides |
6 spectra |
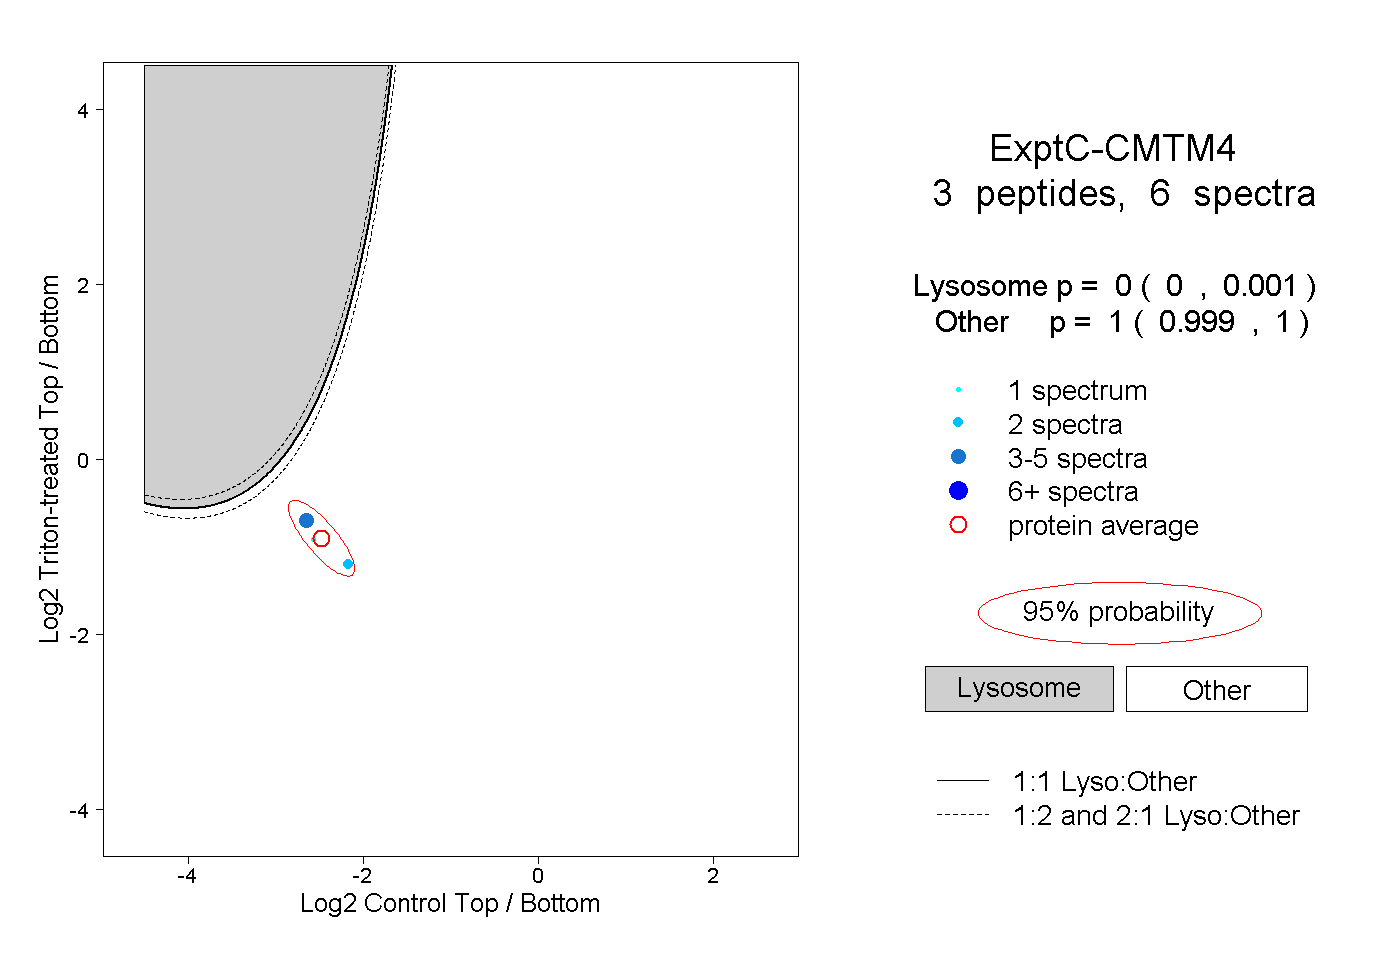 |
0.000 0.000 | 0.001 |
1.000 0.999 | 1.000 |