 4
4peptides
spectra
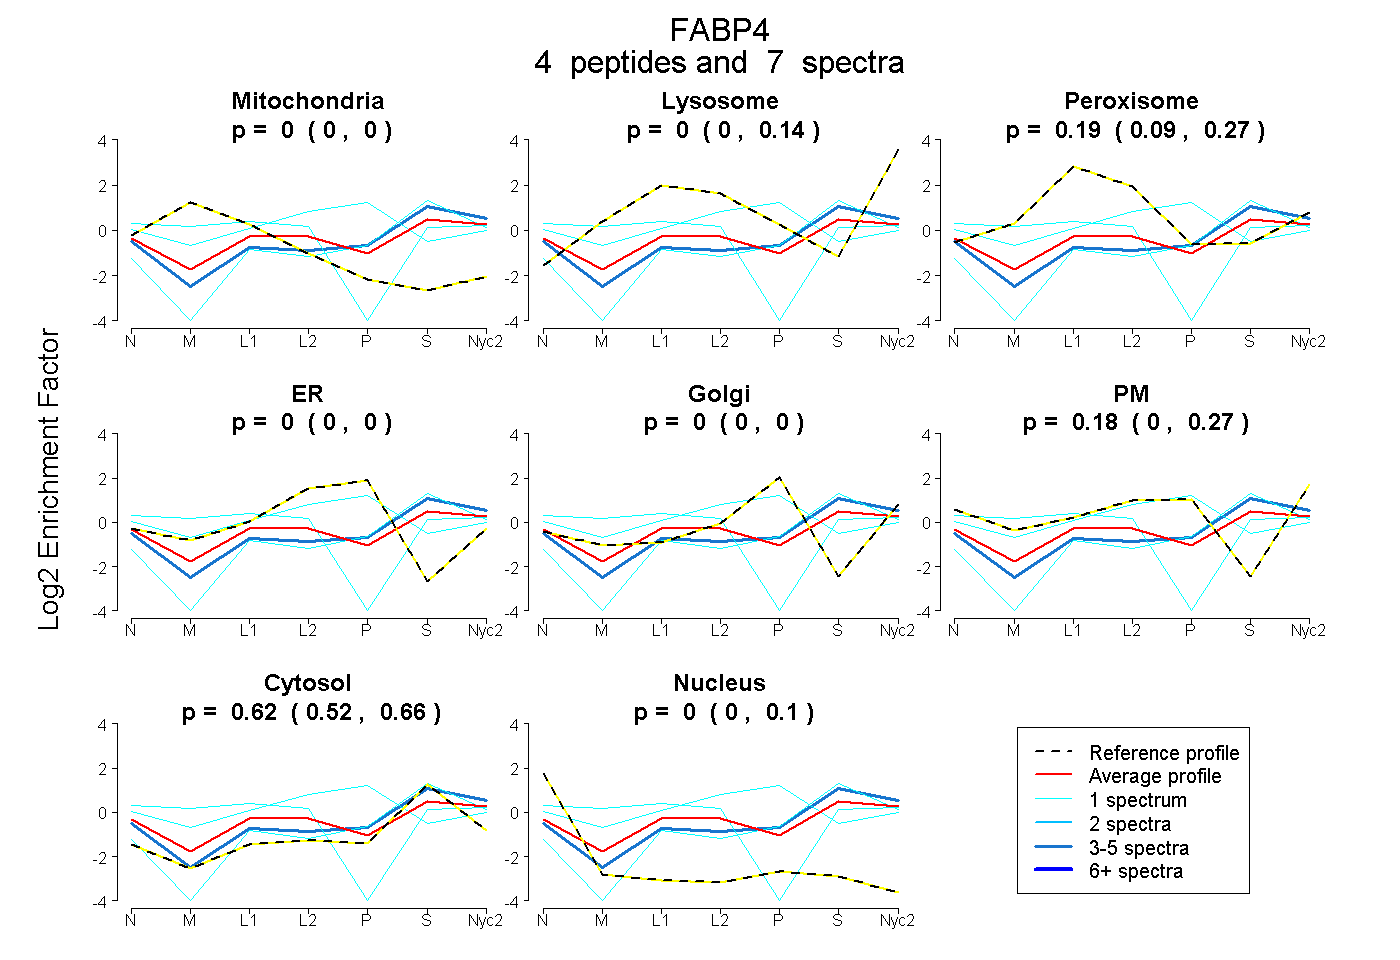
0.000 | 0.000
0.000 | 0.140
0.090 | 0.273
0.000 | 0.000
0.000 | 0.000
0.000 | 0.270
0.516 | 0.664
0.000 | 0.097
| Plot | Mito | Lyso | Perox | ER | Golgi | PM | Cytosol | Nucleus | |||||
| Expt A |
4 peptides |
7 spectra |
|
0.000 0.000 | 0.000 |
0.000 0.000 | 0.140 |
0.194 0.090 | 0.273 |
0.000 0.000 | 0.000 |
0.000 0.000 | 0.000 |
0.182 0.000 | 0.270 |
0.624 0.516 | 0.664 |
0.000 0.000 | 0.097 |
| 1 spectrum, LVSSENFDDYMK | 0.000 | 0.042 | 0.000 | 0.000 | 0.032 | 0.000 | 0.926 | 0.000 | ||
| 1 spectrum, MCDAFVGTWK | 0.000 | 0.000 | 0.192 | 0.377 | 0.095 | 0.107 | 0.229 | 0.000 | ||
| 1 spectrum, LGVEFDEITPDDR | 0.357 | 0.000 | 0.336 | 0.000 | 0.000 | 0.000 | 0.307 | 0.000 | ||
| 4 spectra, EVGVGFATR | 0.000 | 0.094 | 0.000 | 0.000 | 0.000 | 0.139 | 0.767 | 0.000 |
| Plot | Lyso | Other | |||||||||||
| Expt C |
3 peptides |
8 spectra |
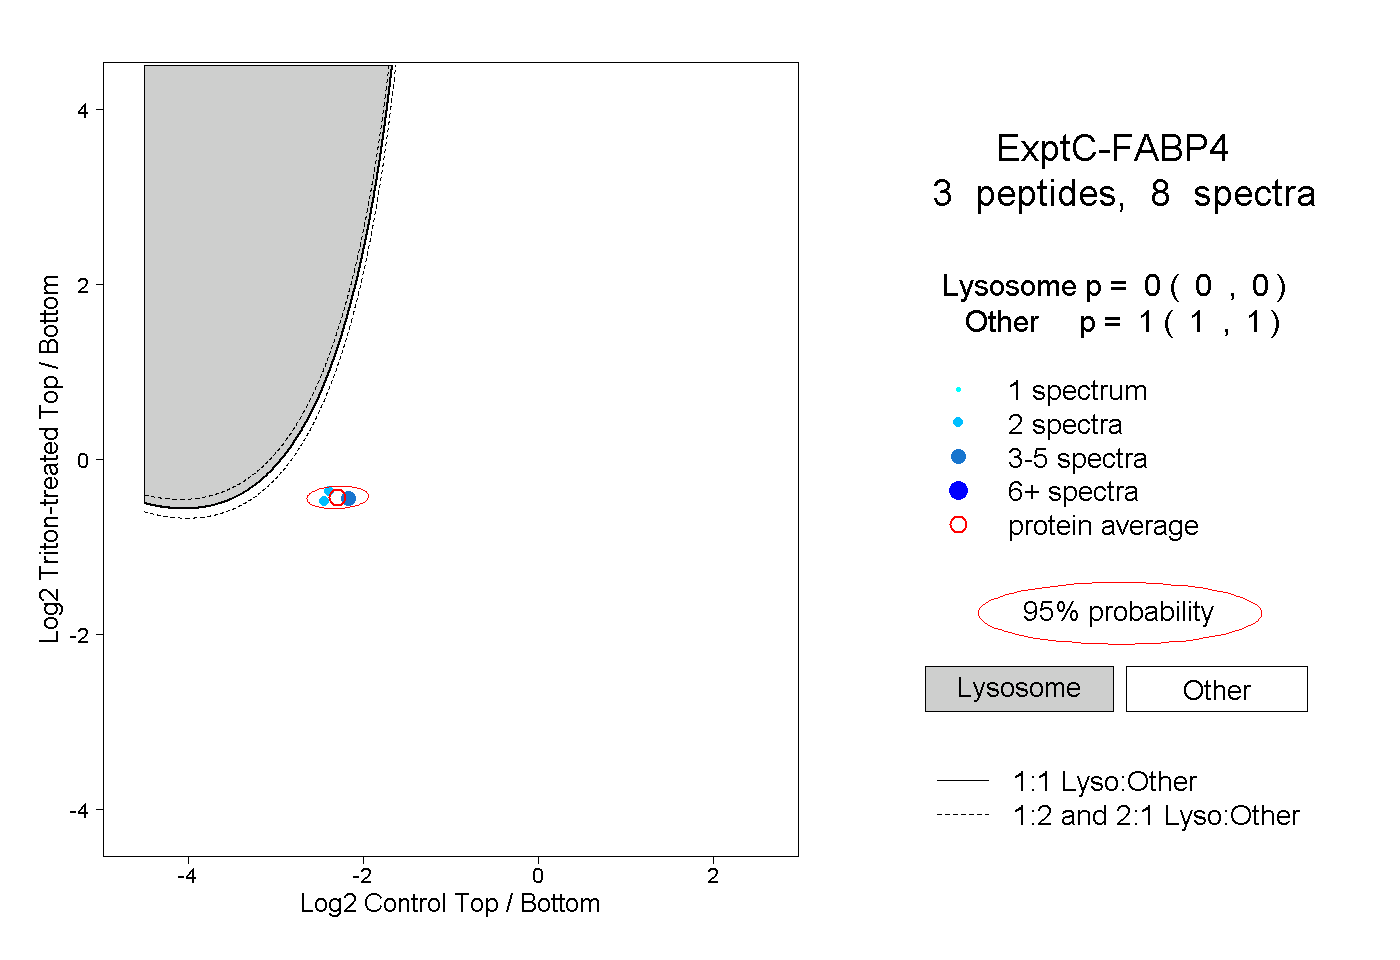 |
0.000 0.000 | 0.000 |
1.000 1.000 | 1.000 |