ATAD1
[ENSRNOP00000014684]
Main page
| | | Plot |
Mito |
Lyso |
|
Perox |
ER |
Golgi |
PM |
Cytosol |
Nucleus |
|
| Expt A |
 6
6
peptides |
9
spectra |
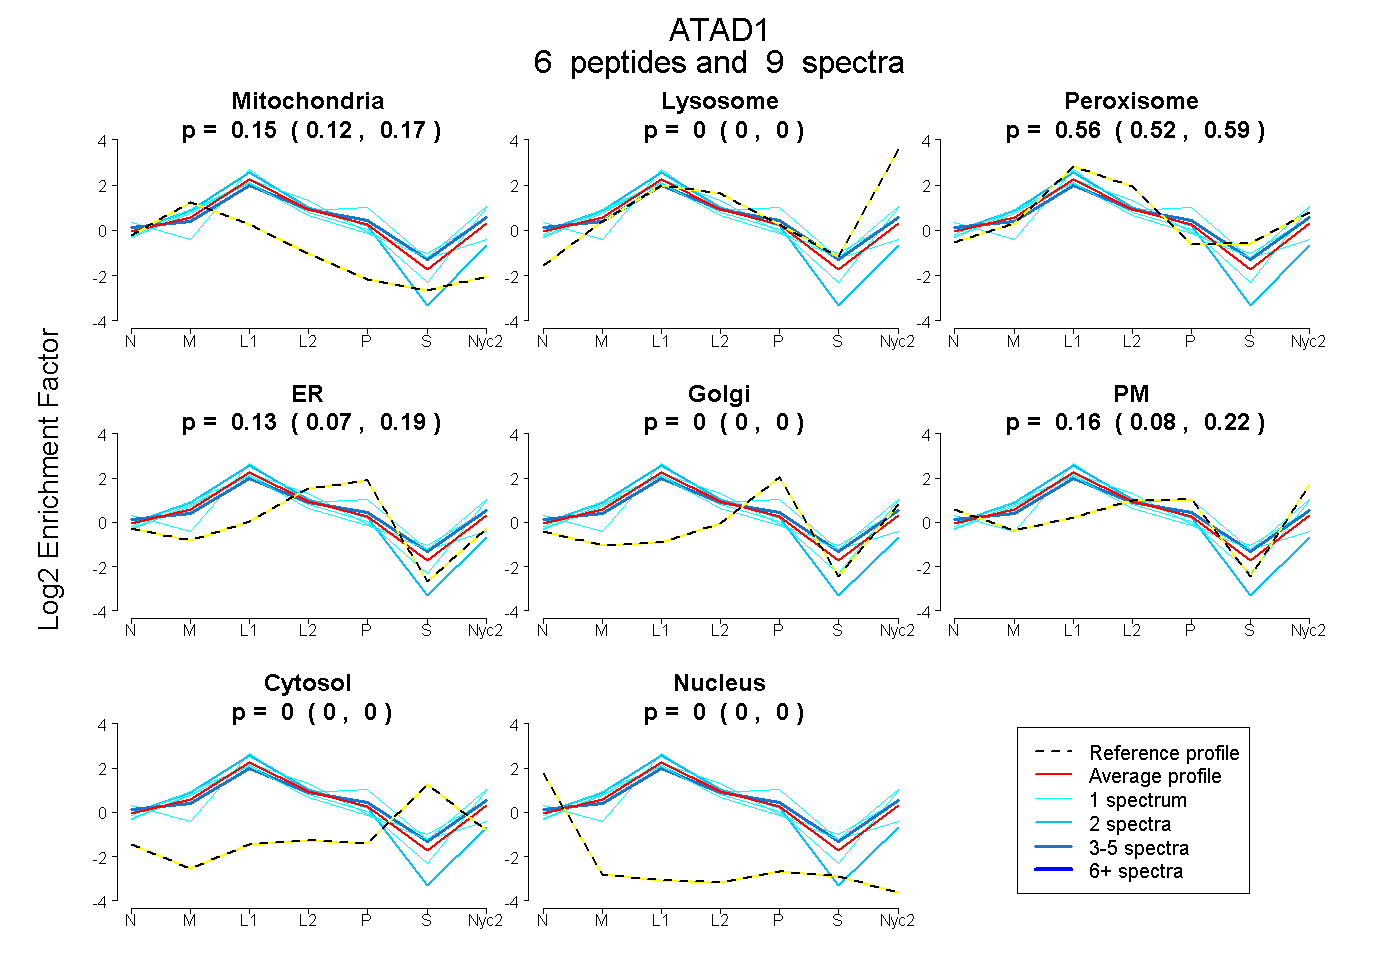 |
0.147
0.122 | 0.170 |
0.000
0.000 | 0.000 |
|
0.559
0.522 | 0.593 |
0.132
0.071 | 0.186 |
0.000
0.000 | 0.000 |
0.162
0.082 | 0.221 |
0.000
0.000 | 0.000 |
0.000
0.000 | 0.000 |
|
| | | Plot |
Mito |
|
Lyso or Perox |
|
ER |
Golgi |
PM |
Cytosol |
Nucleus |
|
| Expt B |
4
peptides |
14
spectra |
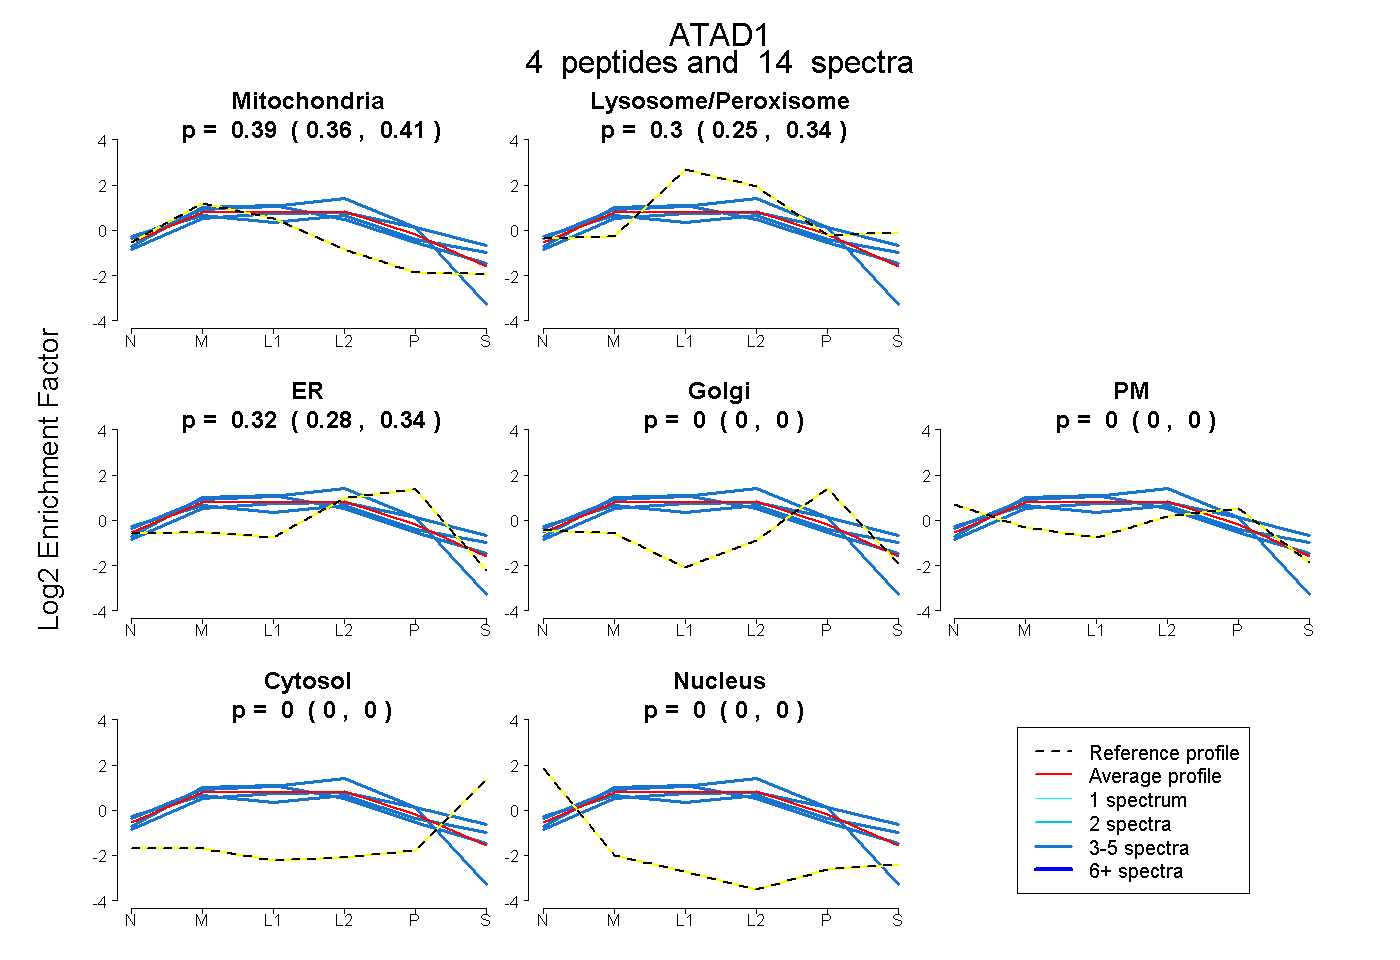 |
0.386
0.357 | 0.409 |
|
0.297
0.252 | 0.336 |
|
0.316
0.282 | 0.345 |
0.000
0.000 | 0.000 |
0.000
0.000 | 0.000 |
0.000
0.000 | 0.000 |
0.000
0.000 | 0.000 |
|
| 4 spectra, VHAEAFSRPLSR |
0.516 |
|
0.313 |
|
0.170 |
0.000 |
0.000 |
0.000 |
0.000 |
|
| 3 spectra, DAALLCVR |
0.334 |
|
0.196 |
|
0.470 |
0.000 |
0.000 |
0.000 |
0.000 |
|
| 4 spectra, GVLLYGPPGCGK |
0.328 |
|
0.295 |
|
0.151 |
0.000 |
0.187 |
0.039 |
0.000 |
|
| 3 spectra, FHINQPALK |
0.195 |
|
0.493 |
|
0.094 |
0.198 |
0.000 |
0.020 |
0.000 |
|
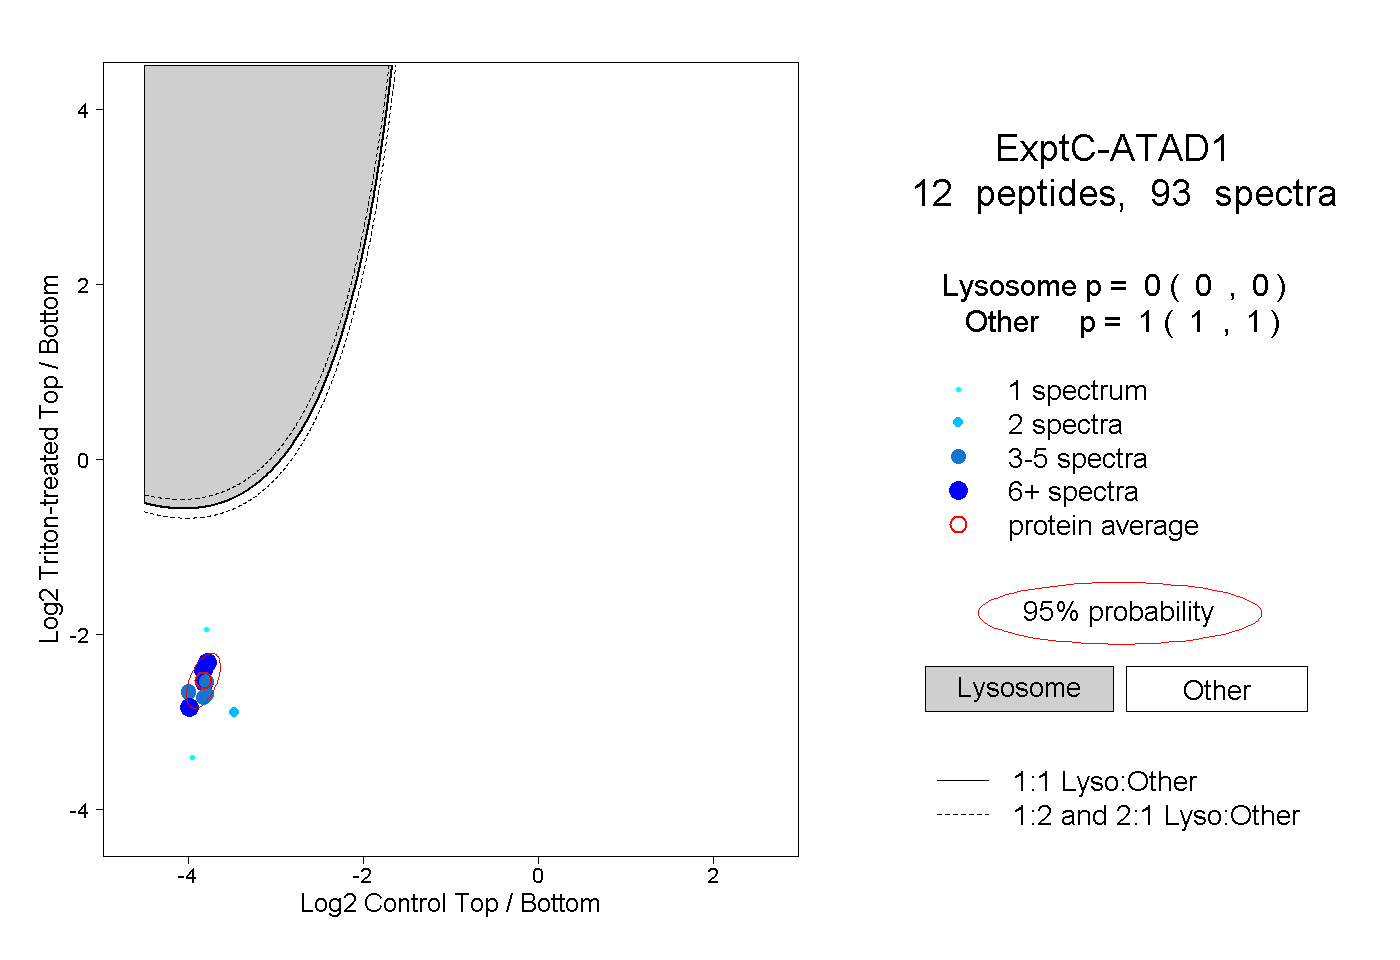
| | | Plot |
|
Lyso |
|
|
|
|
|
|
|
Other |
| Expt C |
12
peptides |
93
spectra |
 |
|
0.000
0.000 | 0.000 |
|
|
|
|
|
|
|
1.000
1.000 | 1.000 |
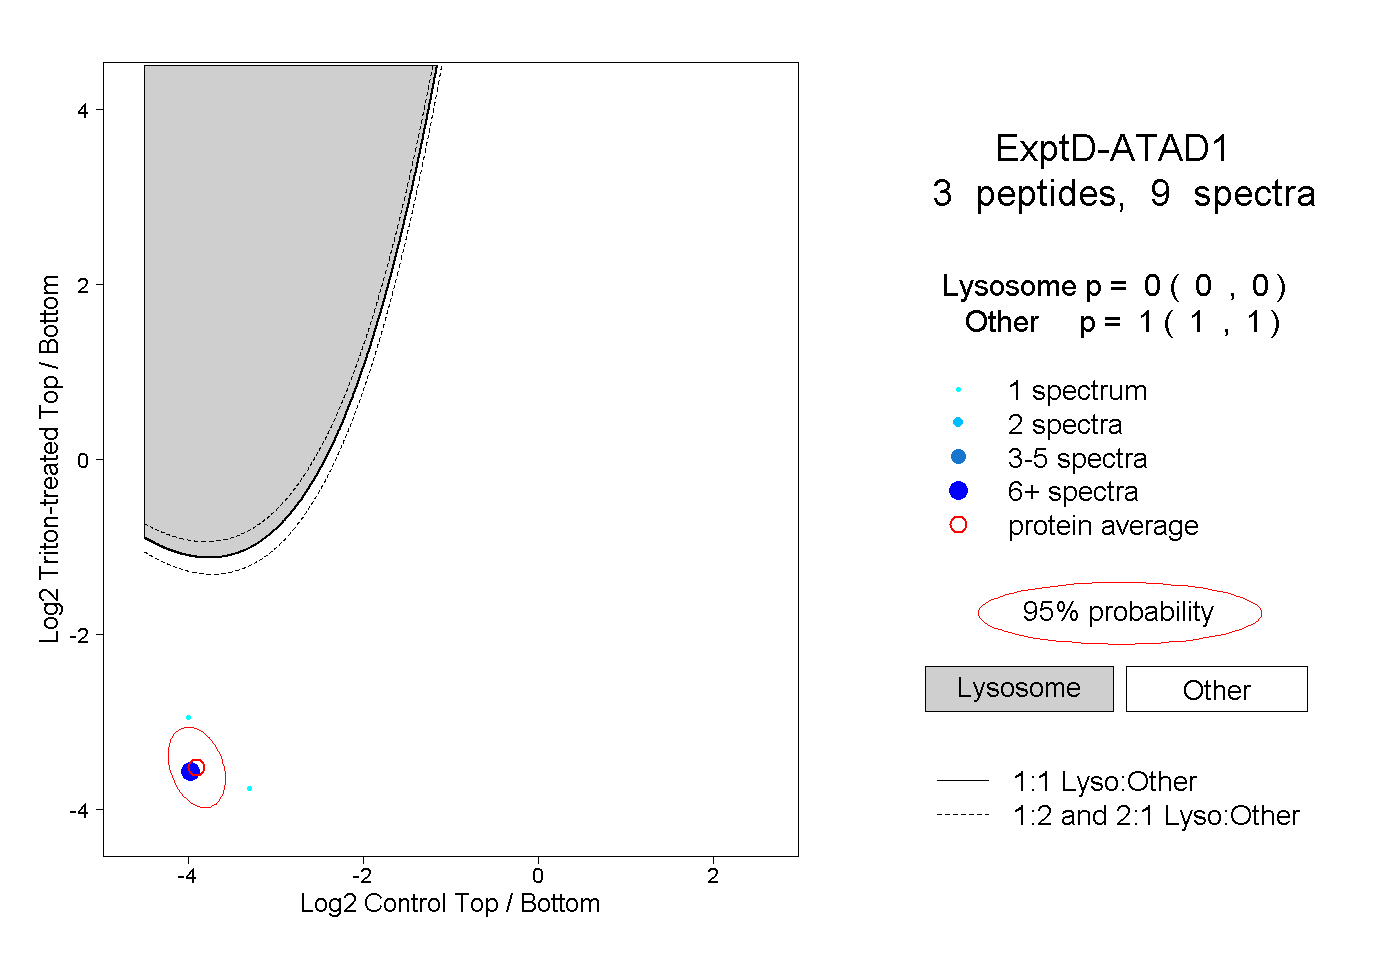
| | | Plot |
|
Lyso |
|
|
|
|
|
|
|
Other |
| Expt D |
3
peptides |
9
spectra |
 |
|
0.000
0.000 | 0.000 |
|
|
|
|
|
|
|
1.000
1.000 | 1.000 |