 6
6peptides
spectra
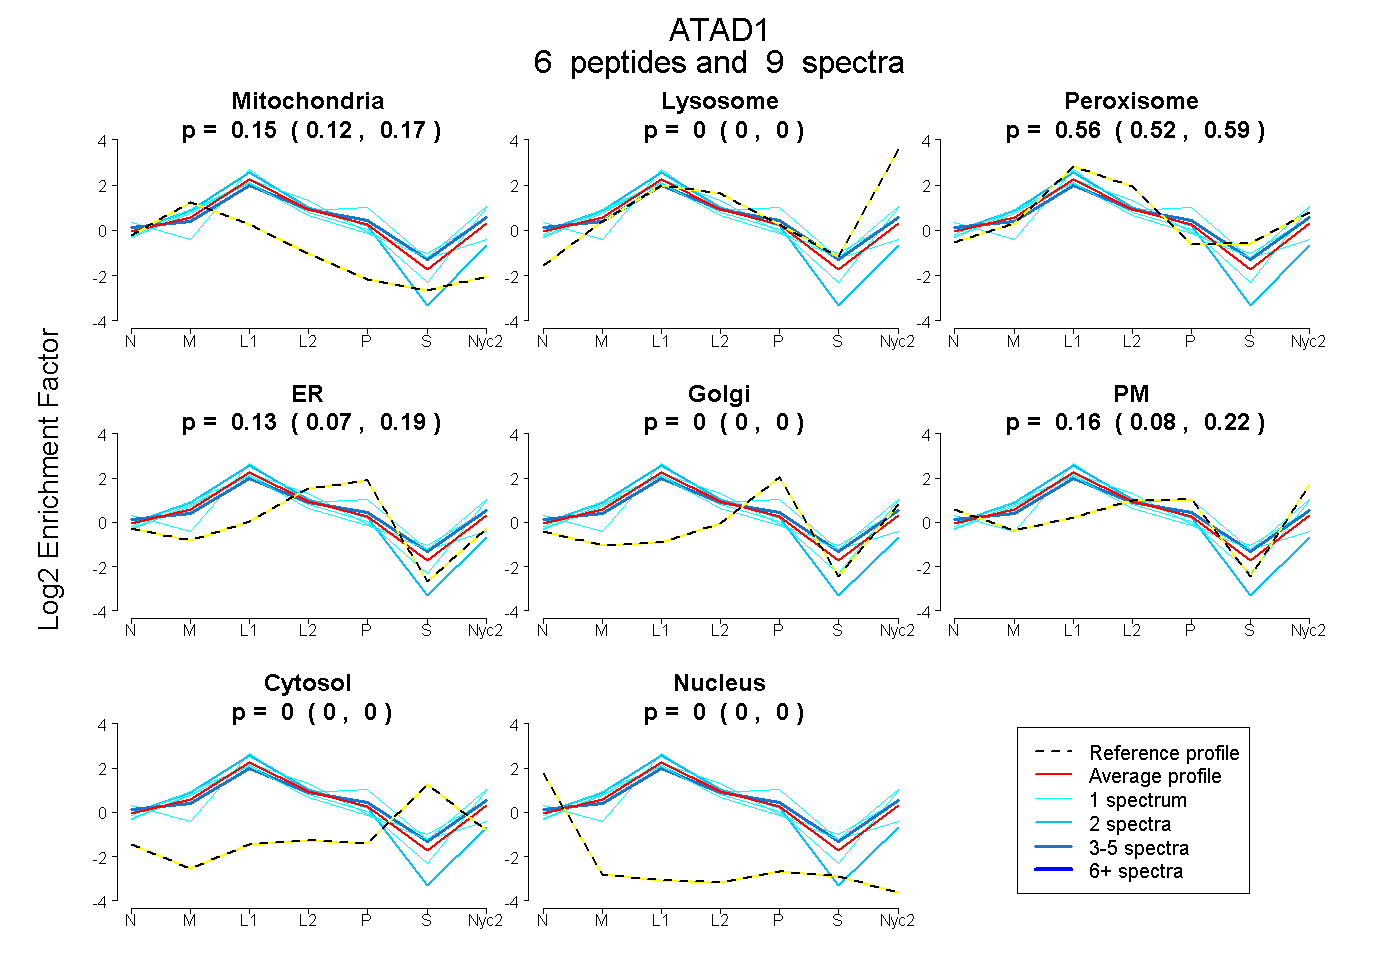
0.122 | 0.170
0.000 | 0.000
0.522 | 0.593
0.071 | 0.186
0.000 | 0.000
0.082 | 0.221
0.000 | 0.000
0.000 | 0.000
| Plot | Mito | Lyso | Perox | ER | Golgi | PM | Cytosol | Nucleus | |||||
| Expt A |
6 peptides |
9 spectra |
|
0.147 0.122 | 0.170 |
0.000 0.000 | 0.000 |
0.559 0.522 | 0.593 |
0.132 0.071 | 0.186 |
0.000 0.000 | 0.000 |
0.162 0.082 | 0.221 |
0.000 0.000 | 0.000 |
0.000 0.000 | 0.000 |
| 1 spectrum, DAAFQSVLTHVCLD | 0.000 | 0.000 | 0.603 | 0.357 | 0.000 | 0.000 | 0.000 | 0.040 | ||
| 3 spectra, VHAEAFSRPLSR | 0.085 | 0.000 | 0.571 | 0.035 | 0.091 | 0.218 | 0.000 | 0.000 | ||
| 2 spectra, DAALLCVR | 0.297 | 0.000 | 0.382 | 0.320 | 0.000 | 0.000 | 0.000 | 0.000 | ||
| 1 spectrum, NEVVGLIFR | 0.224 | 0.214 | 0.309 | 0.000 | 0.000 | 0.254 | 0.000 | 0.000 | ||
| 1 spectrum, WYGESQK | 0.202 | 0.229 | 0.433 | 0.000 | 0.000 | 0.136 | 0.000 | 0.000 | ||
| 1 spectrum, FHINQPALK | 0.112 | 0.027 | 0.715 | 0.046 | 0.012 | 0.089 | 0.000 | 0.000 |
| Plot | Mito | Lyso or Perox | ER | Golgi | PM | Cytosol | Nucleus | ||||||
| Expt B |
4 peptides |
14 spectra |
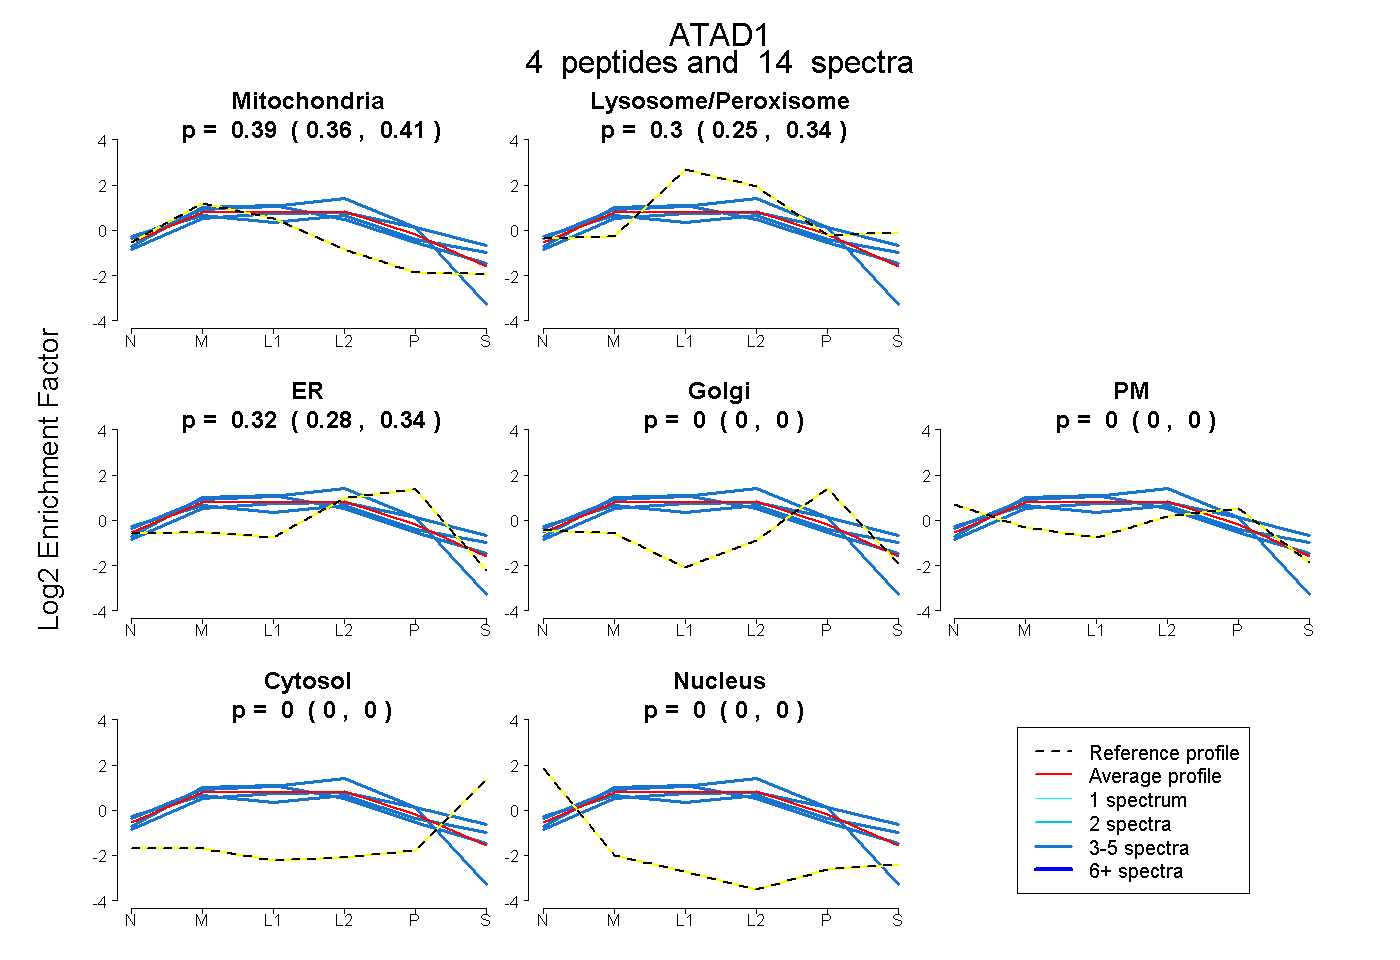 |
0.386 0.357 | 0.409 |
0.297 0.252 | 0.336 |
0.316 0.282 | 0.345 |
0.000 0.000 | 0.000 |
0.000 0.000 | 0.000 |
0.000 0.000 | 0.000 |
0.000 0.000 | 0.000 |
|||
| Plot | Lyso | Other | |||||||||||
| Expt C |
12 peptides |
93 spectra |
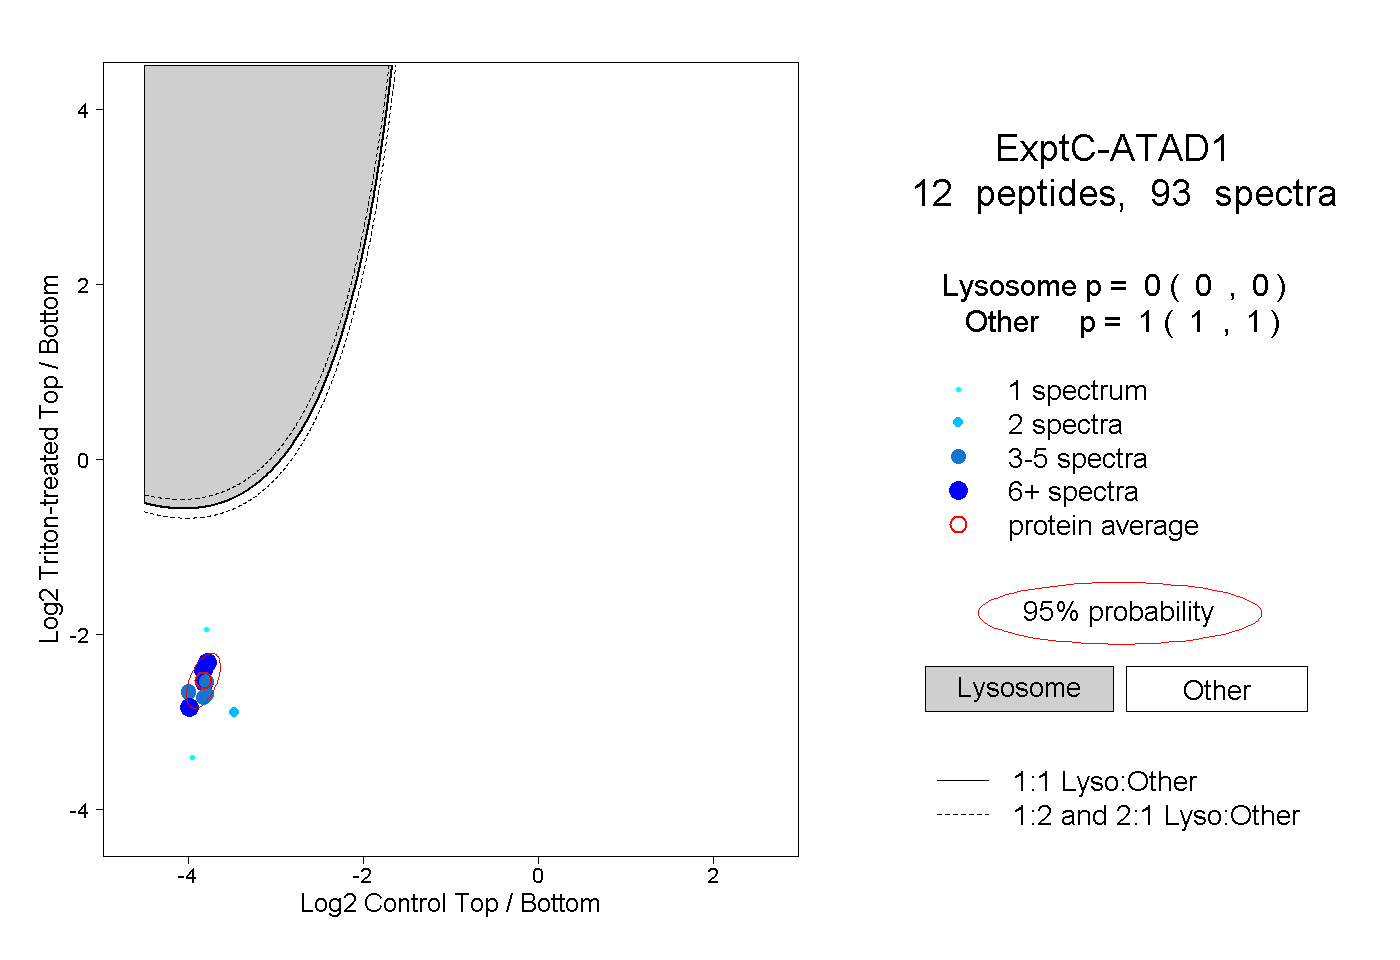 |
0.000 0.000 | 0.000 |
1.000 1.000 | 1.000 |
||||||||
| Plot | Lyso | Other | |||||||||||
| Expt D |
3 peptides |
9 spectra |
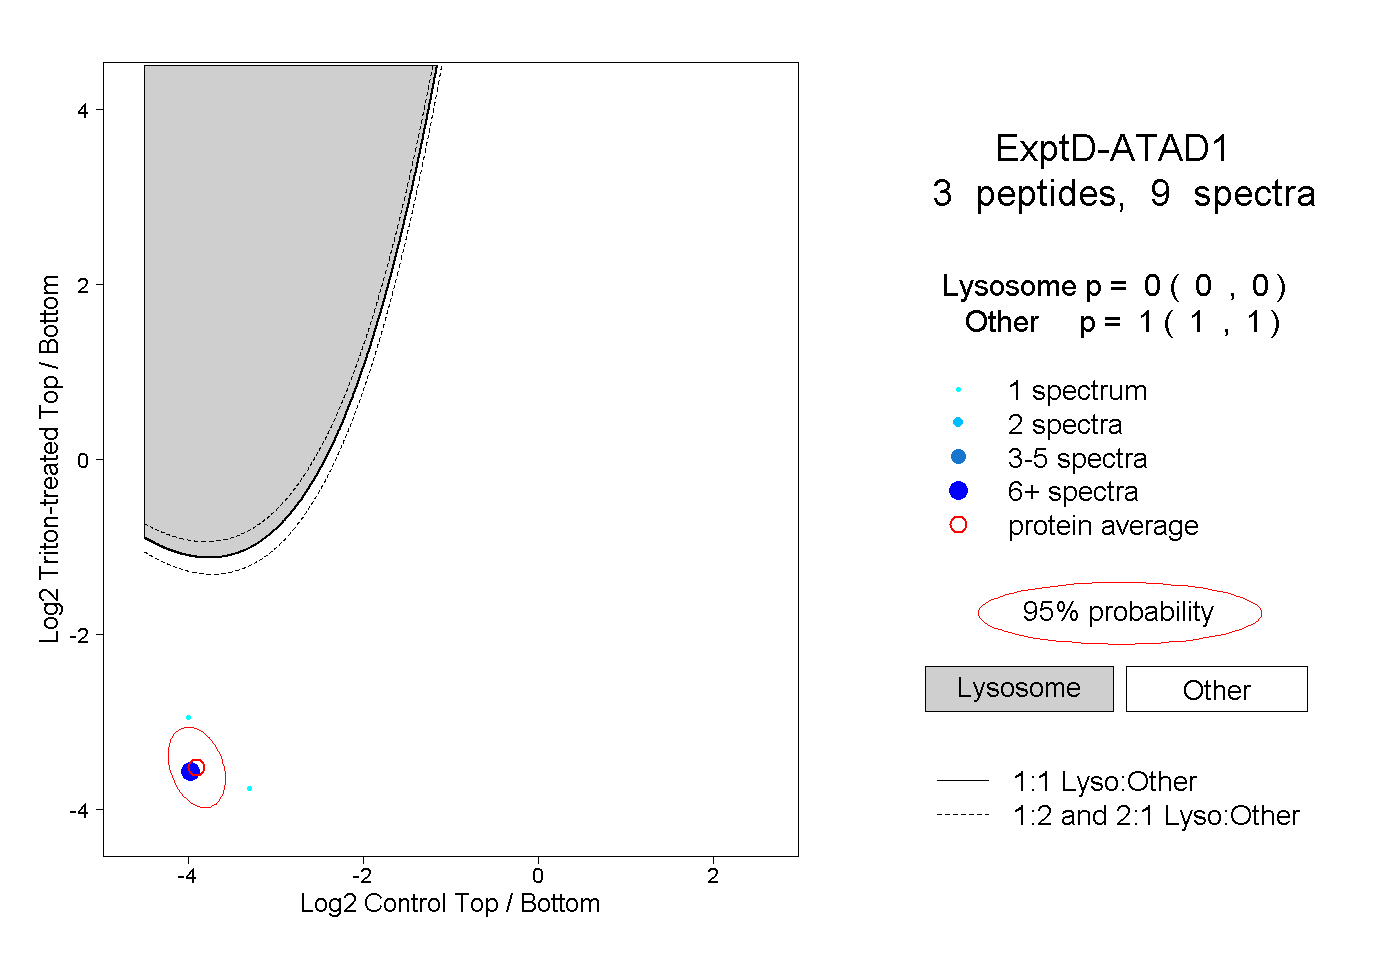 |
0.000 0.000 | 0.000 |
1.000 1.000 | 1.000 |