 6
6peptides
spectra
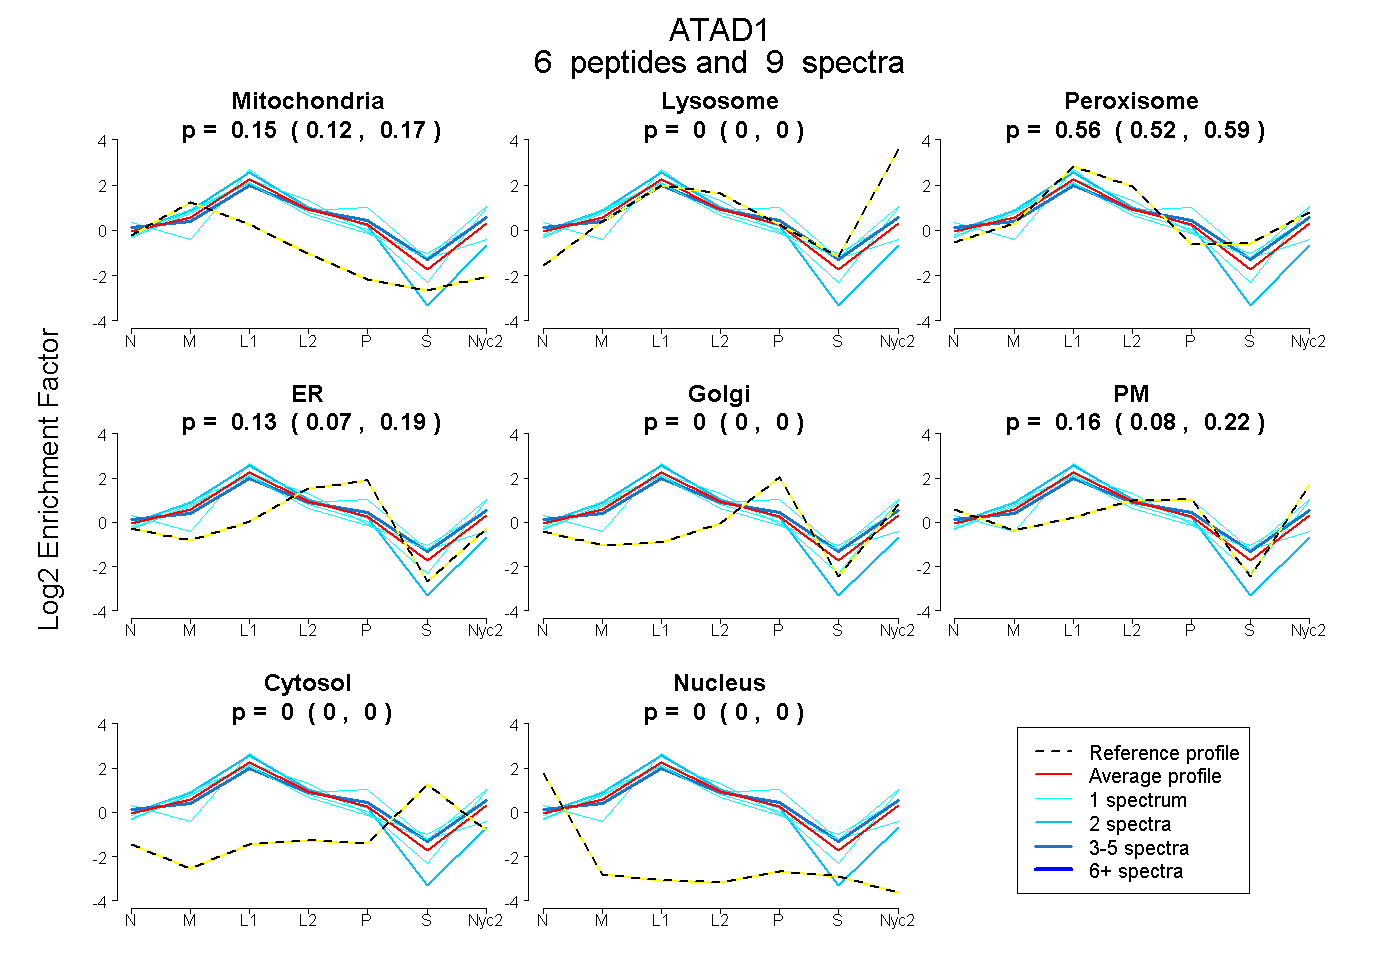
0.122 | 0.170
0.000 | 0.000
0.522 | 0.593
0.071 | 0.186
0.000 | 0.000
0.082 | 0.221
0.000 | 0.000
0.000 | 0.000
4peptides
spectra
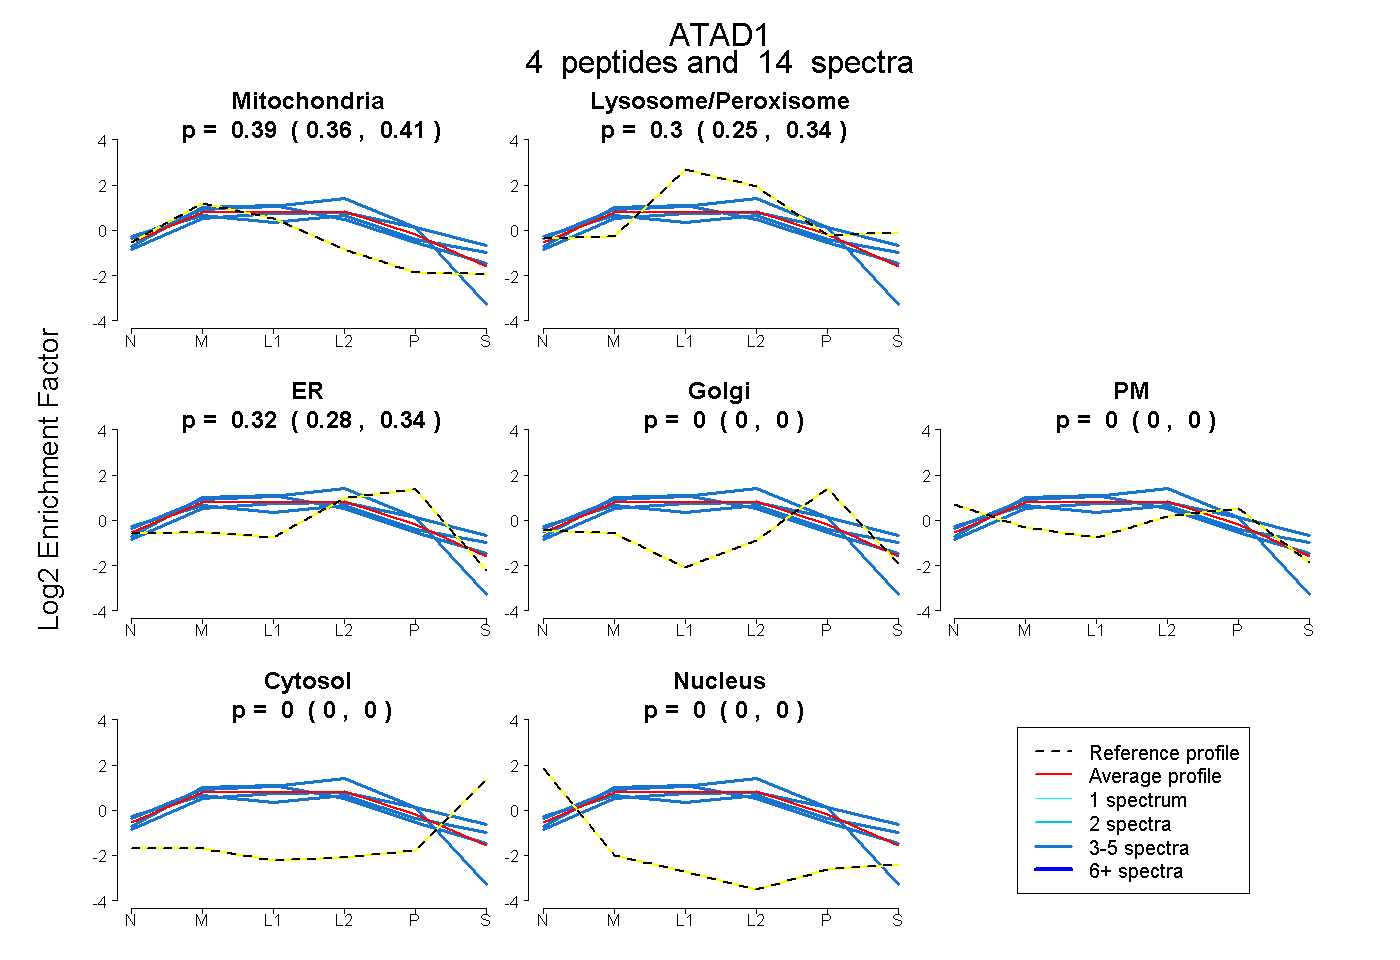
0.357 | 0.409
0.252 | 0.336
0.282 | 0.345
0.000 | 0.000
0.000 | 0.000
0.000 | 0.000
0.000 | 0.000
12peptides
spectra
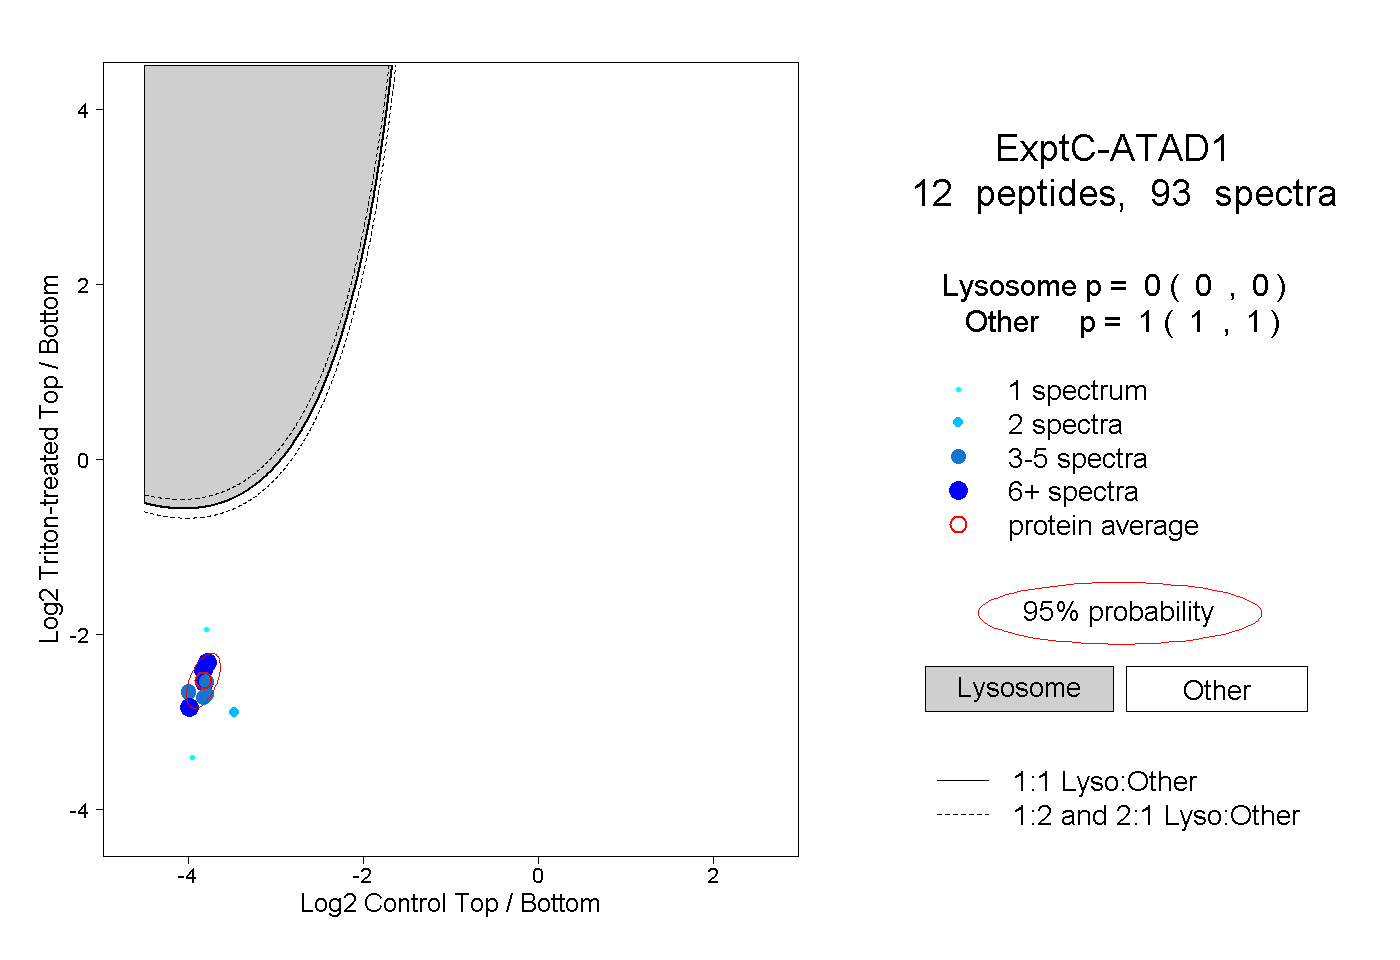
0.000 | 0.000
1.000 | 1.000
3peptides
spectra
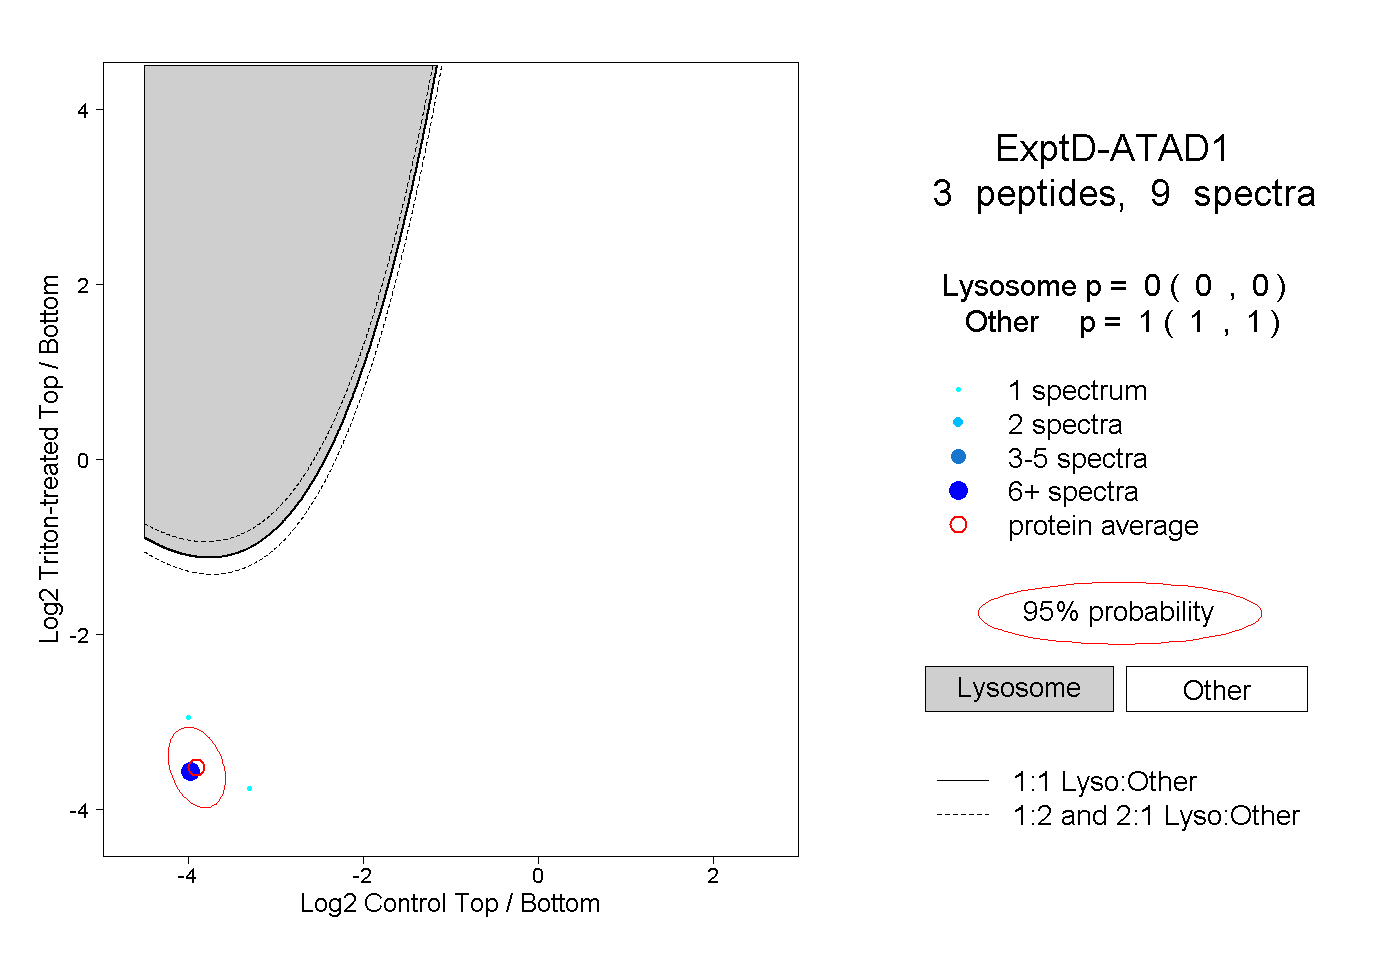
0.000 | 0.000
1.000 | 1.000