 15
15peptides
spectra
0.956 | 0.959
0.000 | 0.000
0.000 | 0.000
0.000 | 0.000
0.000 | 0.000
0.000 | 0.000
0.000 | 0.000
0.041 | 0.044
| Plot | Mito | Lyso | Perox | ER | Golgi | PM | Cytosol | Nucleus | |||||
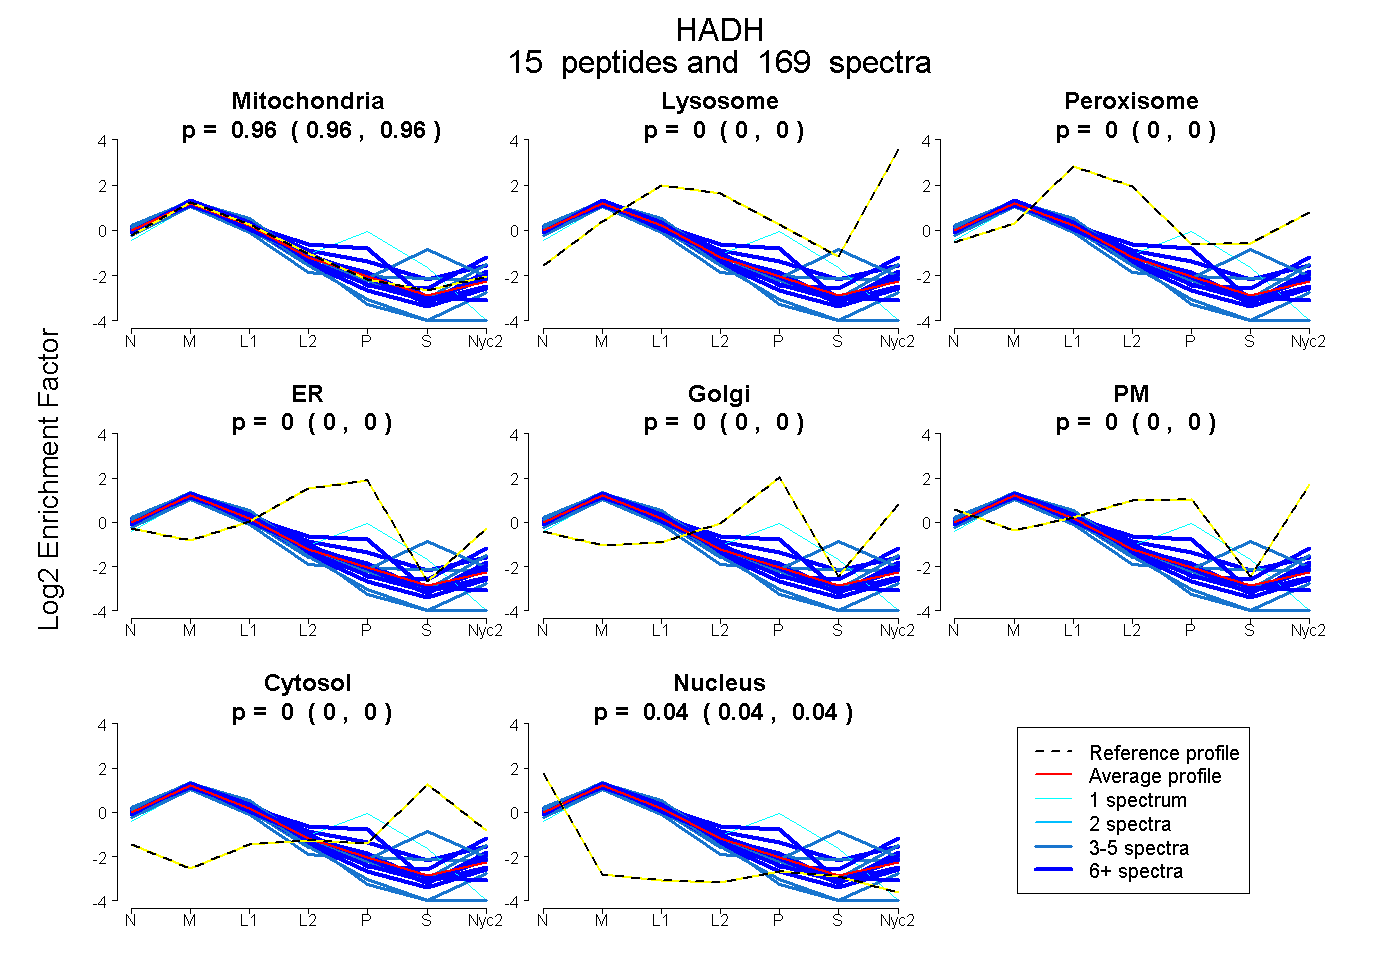
| Expt A |
15 peptides |
169 spectra |
|
0.957 0.956 | 0.959 |
0.000 0.000 | 0.000 |
0.000 0.000 | 0.000 |
0.000 0.000 | 0.000 |
0.000 0.000 | 0.000 |
0.000 0.000 | 0.000 |
0.000 0.000 | 0.000 |
0.043 0.041 | 0.044 |
| 16 spectra, HPVSCK | 0.765 | 0.000 | 0.000 | 0.224 | 0.000 | 0.000 | 0.000 | 0.011 | ||
| 34 spectra, TPMTSQK | 0.977 | 0.000 | 0.000 | 0.000 | 0.000 | 0.000 | 0.000 | 0.023 | ||
| 4 spectra, NELFQR | 0.918 | 0.000 | 0.000 | 0.000 | 0.000 | 0.054 | 0.000 | 0.028 | ||
| 5 spectra, GIEESLK | 0.760 | 0.000 | 0.000 | 0.000 | 0.000 | 0.000 | 0.240 | 0.000 | ||
| 9 spectra, LLVPYLIEAIR | 0.921 | 0.000 | 0.000 | 0.000 | 0.000 | 0.000 | 0.000 | 0.079 | ||
| 6 spectra, FTENPK | 0.923 | 0.000 | 0.000 | 0.000 | 0.000 | 0.049 | 0.000 | 0.028 | ||
| 6 spectra, TGEGFYK | 0.971 | 0.000 | 0.000 | 0.000 | 0.000 | 0.020 | 0.000 | 0.009 | ||
| 3 spectra, LVEVLK | 0.865 | 0.000 | 0.000 | 0.000 | 0.000 | 0.000 | 0.000 | 0.135 | ||
| 1 spectrum, FAAEHTIFASNTSSLQITNIANATTR | 0.710 | 0.000 | 0.000 | 0.175 | 0.000 | 0.000 | 0.033 | 0.082 | ||
| 23 spectra, AADEFVEK | 0.944 | 0.000 | 0.000 | 0.008 | 0.000 | 0.000 | 0.000 | 0.048 | ||
| 4 spectra, LGAGYPMGPFELLDYVGLDTTK | 0.936 | 0.000 | 0.000 | 0.000 | 0.000 | 0.000 | 0.000 | 0.064 | ||
| 6 spectra, FAGLHFFNPVPMMK | 0.860 | 0.098 | 0.000 | 0.000 | 0.000 | 0.000 | 0.000 | 0.042 | ||
| 29 spectra, DTPGFIVNR | 0.805 | 0.000 | 0.052 | 0.000 | 0.098 | 0.029 | 0.017 | 0.000 | ||
| 19 spectra, TFESLVDFCK | 0.923 | 0.000 | 0.000 | 0.000 | 0.000 | 0.000 | 0.000 | 0.077 | ||
| 4 spectra, EDIDTAMK | 0.893 | 0.000 | 0.000 | 0.000 | 0.000 | 0.000 | 0.049 | 0.058 |
| Plot | Mito | Lyso or Perox | ER | Golgi | PM | Cytosol | Nucleus | ||||||
| Expt B |
13 peptides |
92 spectra |
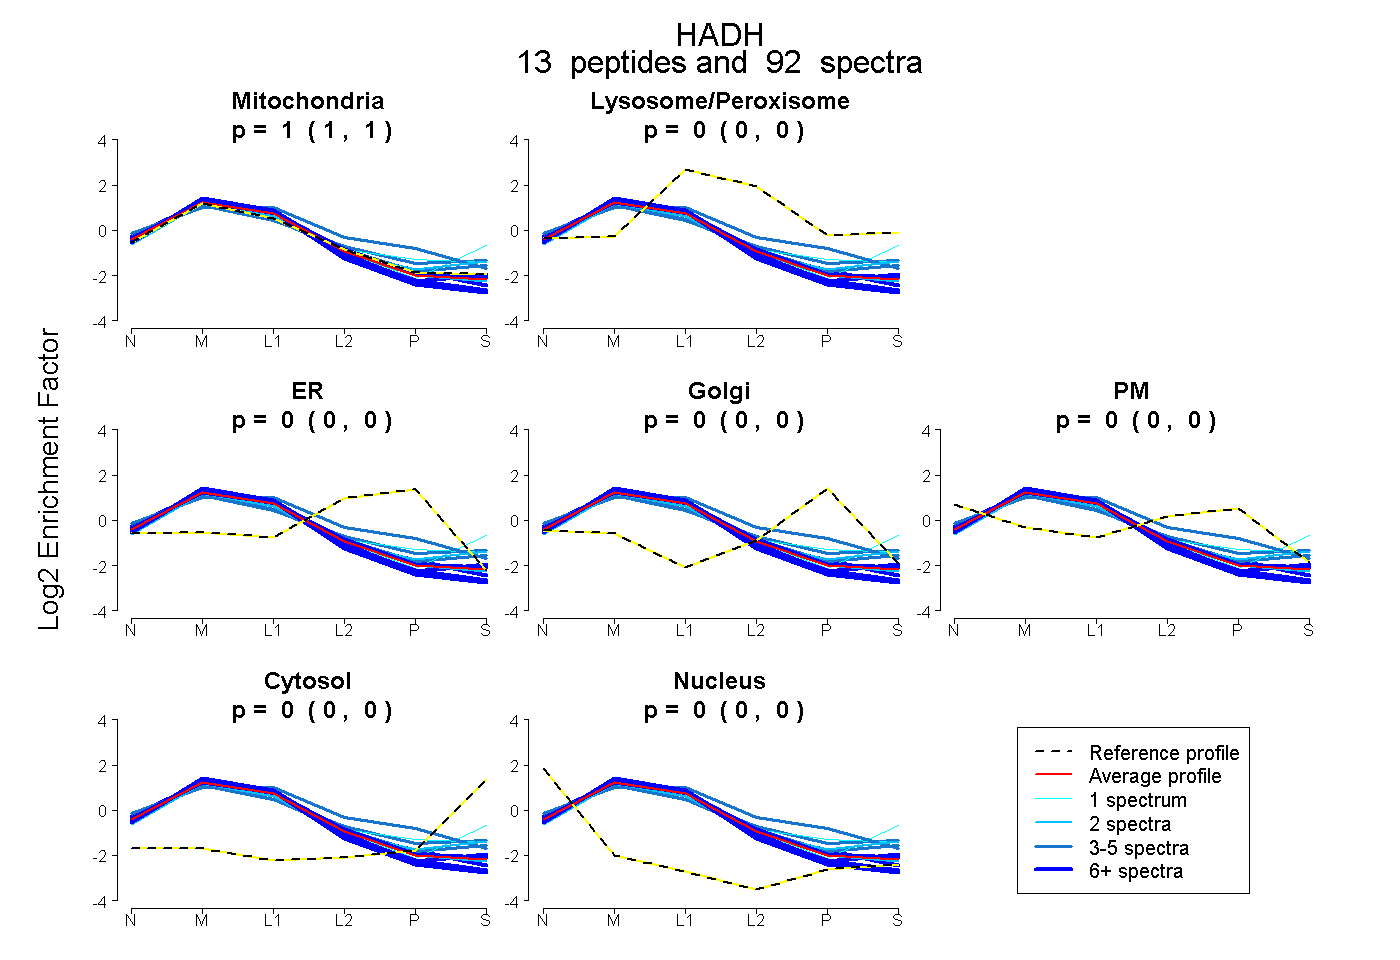 |
1.000 1.000 | 1.000 |
0.000 0.000 | 0.000 |
0.000 0.000 | 0.000 |
0.000 0.000 | 0.000 |
0.000 0.000 | 0.000 |
0.000 0.000 | 0.000 |
0.000 0.000 | 0.000 |
|||
| Plot | Lyso | Other | |||||||||||
| Expt C |
14 peptides |
1096 spectra |
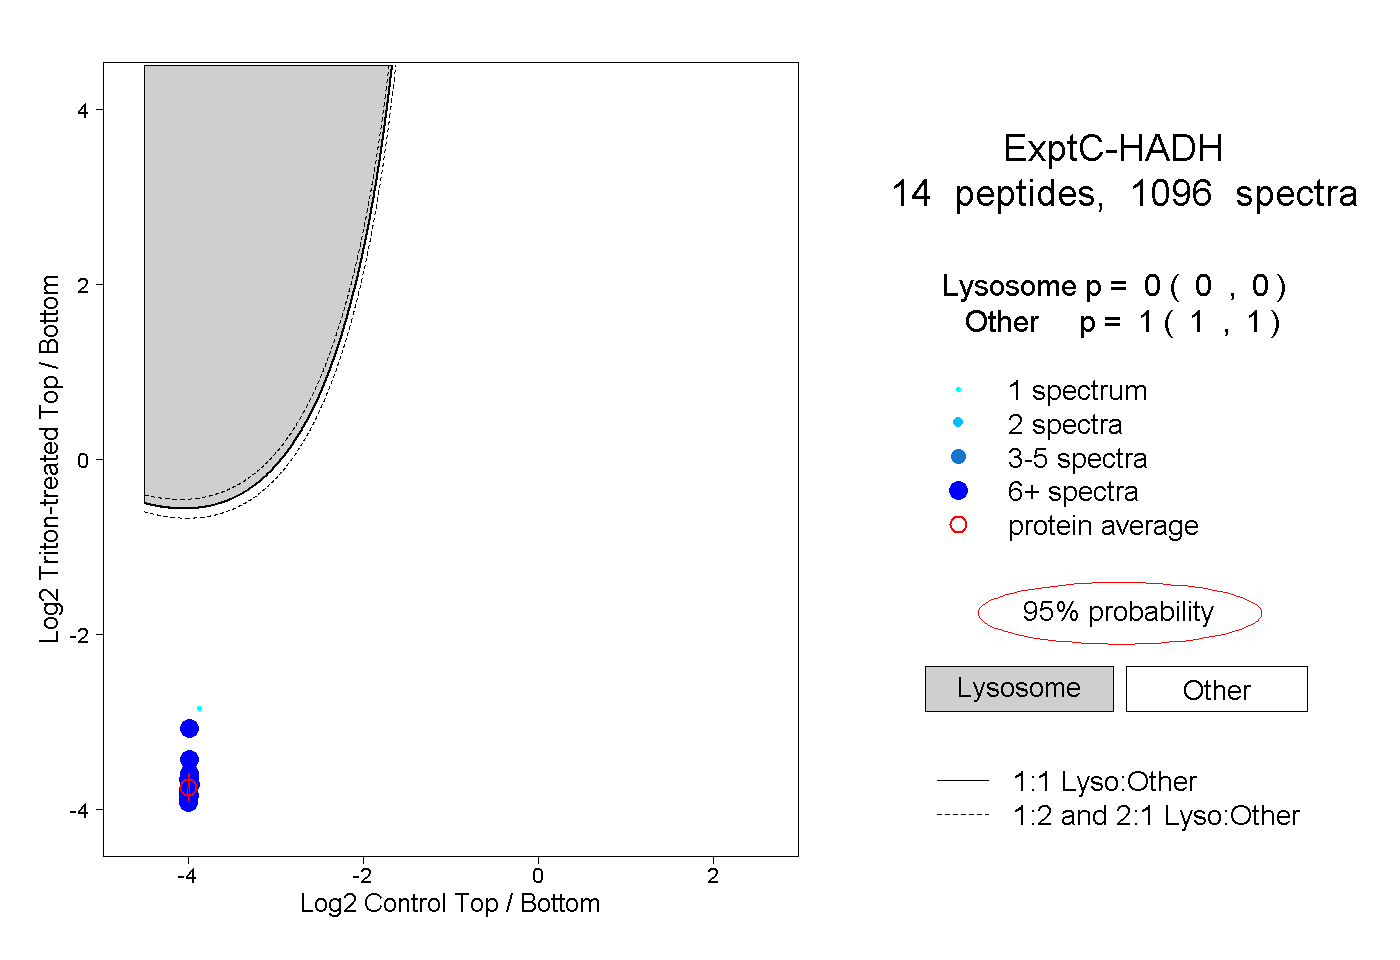 |
0.000 0.000 | 0.000 |
1.000 1.000 | 1.000 |
||||||||
| Plot | Lyso | Other | |||||||||||
| Expt D |
11 peptides |
64 spectra |
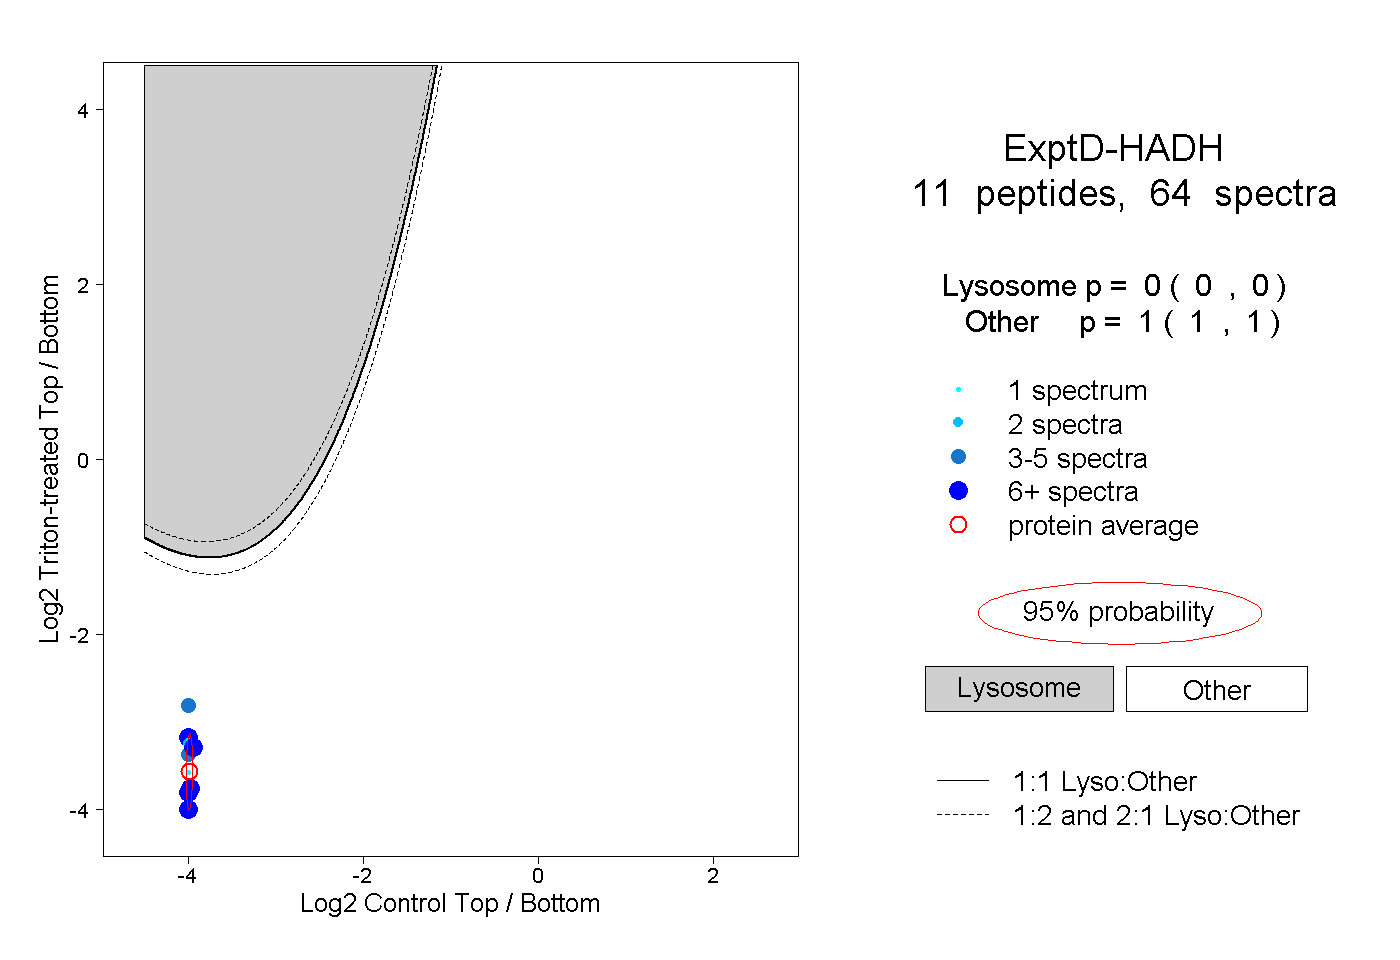 |
0.000 0.000 | 0.000 |
1.000 1.000 | 1.000 |