20
20peptides
spectra
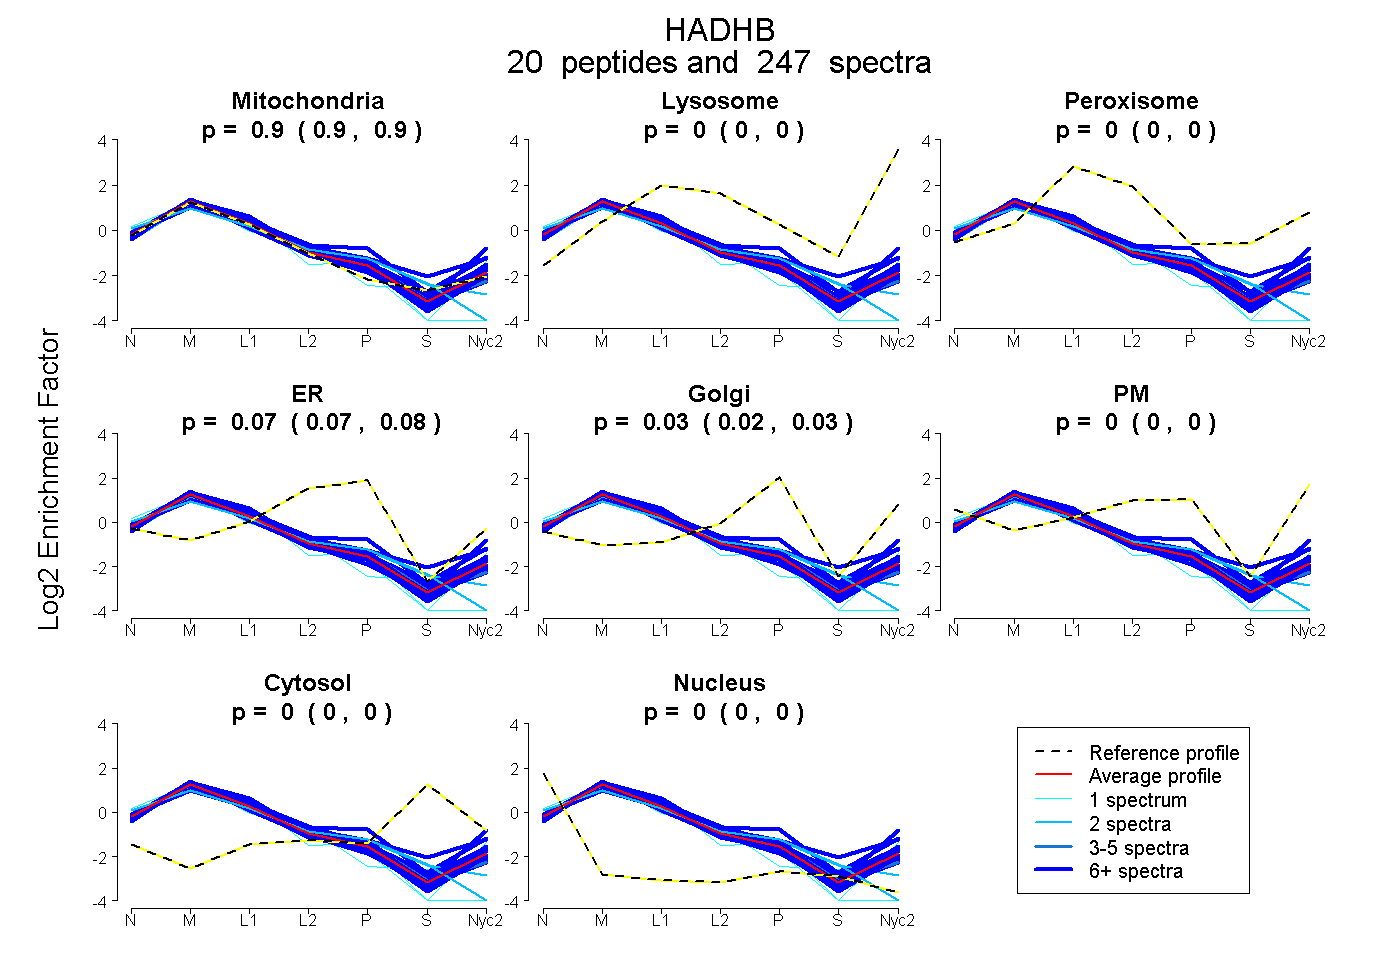
0.899 | 0.902
0.000 | 0.000
0.000 | 0.000
0.069 | 0.076
0.022 | 0.030
0.000 | 0.000
0.000 | 0.000
0.000 | 0.000
13peptides
spectra
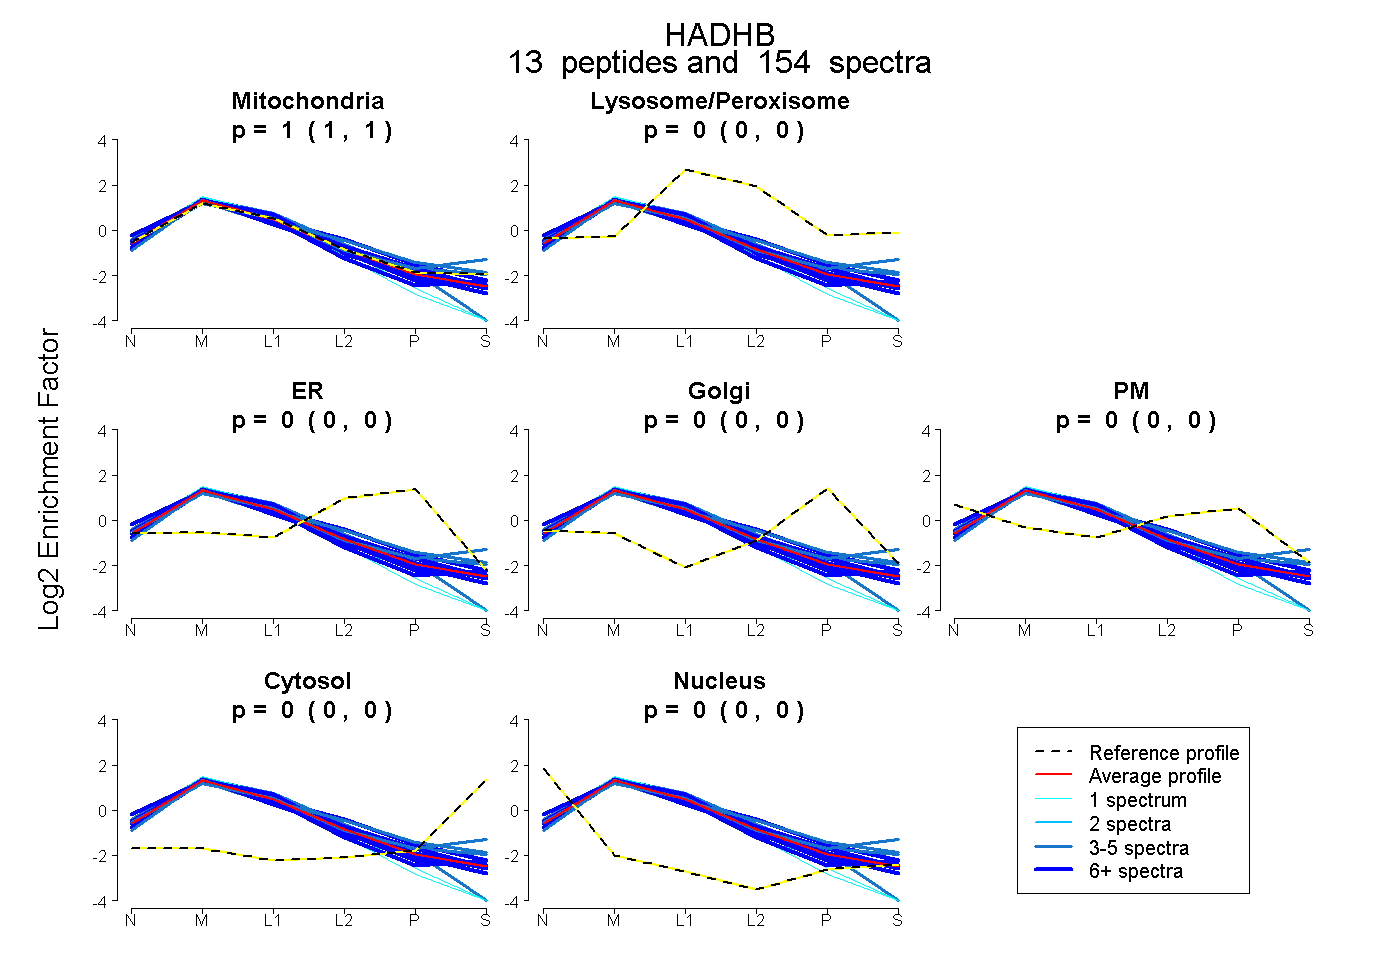
0.998 | 1.000
0.000 | 0.000
0.000 | 0.000
0.000 | 0.000
0.000 | 0.000
0.000 | 0.000
0.000 | 0.002
20peptides
spectra
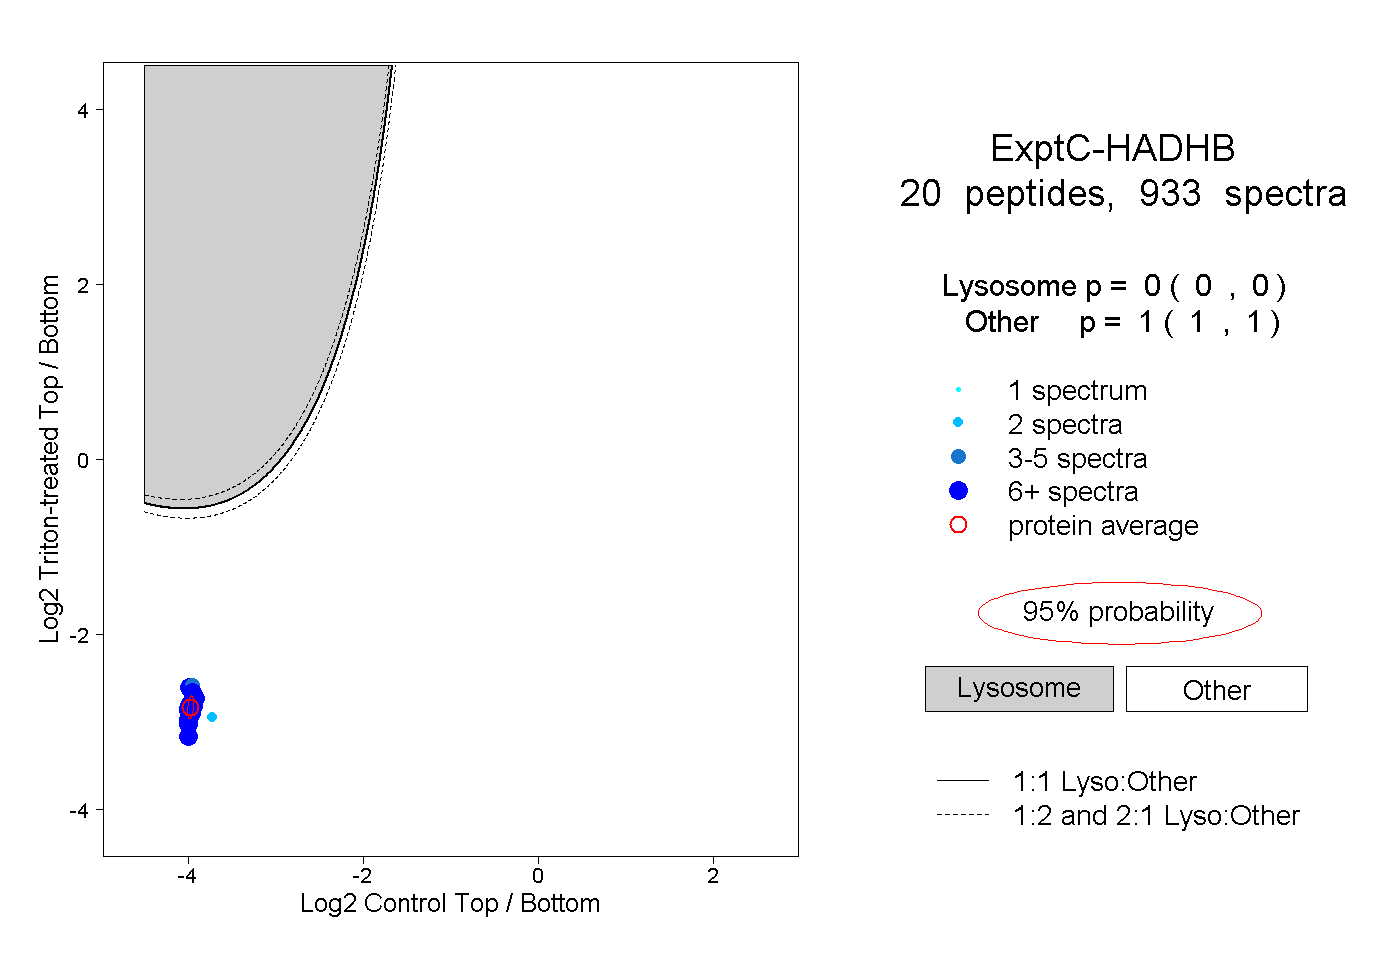
0.000 | 0.000
1.000 | 1.000