 20
20peptides
spectra
0.899 | 0.902
0.000 | 0.000
0.000 | 0.000
0.069 | 0.076
0.022 | 0.030
0.000 | 0.000
0.000 | 0.000
0.000 | 0.000
| Plot | Mito | Lyso | Perox | ER | Golgi | PM | Cytosol | Nucleus | |||||
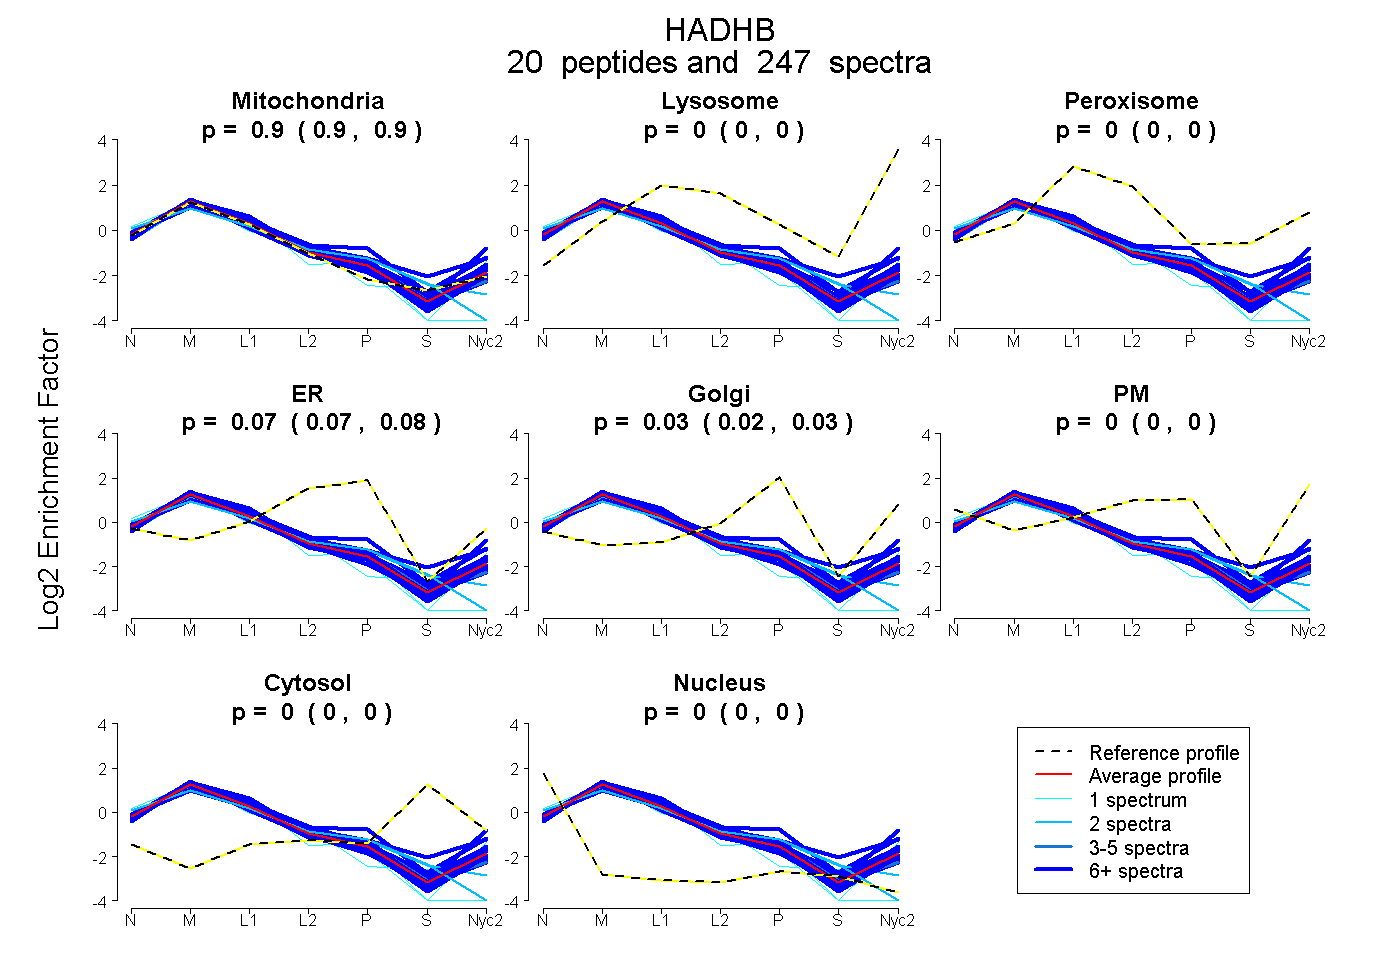
| Expt A |
20 peptides |
247 spectra |
|
0.901 0.899 | 0.902 |
0.000 0.000 | 0.000 |
0.000 0.000 | 0.000 |
0.073 0.069 | 0.076 |
0.026 0.022 | 0.030 |
0.000 0.000 | 0.000 |
0.000 0.000 | 0.000 |
0.000 0.000 | 0.000 |
| 13 spectra, LAAAFAVSR | 0.874 | 0.000 | 0.000 | 0.002 | 0.058 | 0.066 | 0.000 | 0.000 | ||
| 7 spectra, DFIYVSQDPK | 0.956 | 0.000 | 0.000 | 0.016 | 0.023 | 0.000 | 0.000 | 0.004 | ||
| 15 spectra, MMLDLNK | 0.874 | 0.000 | 0.000 | 0.068 | 0.058 | 0.000 | 0.000 | 0.000 | ||
| 20 spectra, NIVVVEGVR | 0.906 | 0.000 | 0.000 | 0.000 | 0.044 | 0.050 | 0.000 | 0.000 | ||
| 23 spectra, IPFLLSGTSYK | 0.923 | 0.000 | 0.000 | 0.064 | 0.000 | 0.000 | 0.000 | 0.013 | ||
| 12 spectra, DLMPHDLAR | 0.760 | 0.000 | 0.000 | 0.185 | 0.055 | 0.000 | 0.000 | 0.000 | ||
| 2 spectra, VGAPPLEK | 0.835 | 0.000 | 0.000 | 0.054 | 0.000 | 0.000 | 0.000 | 0.111 | ||
| 2 spectra, DQLLLGPTYATPK | 0.910 | 0.000 | 0.000 | 0.083 | 0.000 | 0.000 | 0.000 | 0.006 | ||
| 18 spectra, AMDSDWFAQNYMGR | 0.927 | 0.000 | 0.000 | 0.045 | 0.000 | 0.028 | 0.000 | 0.000 | ||
| 6 spectra, DNGIRPSSLEQMAK | 0.799 | 0.020 | 0.000 | 0.000 | 0.000 | 0.181 | 0.000 | 0.000 | ||
| 21 spectra, AALSGLLYR | 0.947 | 0.000 | 0.000 | 0.013 | 0.040 | 0.000 | 0.000 | 0.000 | ||
| 1 spectrum, AGLTMNDIDAFEFHEAFSGQILANFK | 0.903 | 0.000 | 0.000 | 0.000 | 0.000 | 0.000 | 0.000 | 0.097 | ||
| 10 spectra, SHSLAK | 0.763 | 0.039 | 0.000 | 0.000 | 0.000 | 0.198 | 0.000 | 0.000 | ||
| 10 spectra, EAALGAGFSDK | 0.726 | 0.004 | 0.061 | 0.000 | 0.089 | 0.074 | 0.045 | 0.000 | ||
| 62 spectra, LVMAAANR | 0.947 | 0.000 | 0.000 | 0.017 | 0.036 | 0.000 | 0.000 | 0.000 | ||
| 8 spectra, DVVDYIIFGTVIQEVK | 0.959 | 0.000 | 0.000 | 0.041 | 0.000 | 0.000 | 0.000 | 0.000 | ||
| 10 spectra, TSNVAR | 0.916 | 0.000 | 0.000 | 0.000 | 0.011 | 0.073 | 0.000 | 0.000 | ||
| 1 spectrum, ALAMGYKPK | 1.000 | 0.000 | 0.000 | 0.000 | 0.000 | 0.000 | 0.000 | 0.000 | ||
| 1 spectrum, LSILTK | 0.897 | 0.000 | 0.000 | 0.000 | 0.000 | 0.103 | 0.000 | 0.000 | ||
| 5 spectra, LNFLSPELPAVAEFSTNETMGHSADR | 0.911 | 0.000 | 0.000 | 0.089 | 0.000 | 0.000 | 0.000 | 0.000 |
| Plot | Mito | Lyso or Perox | ER | Golgi | PM | Cytosol | Nucleus | ||||||
| Expt B |
13 peptides |
154 spectra |
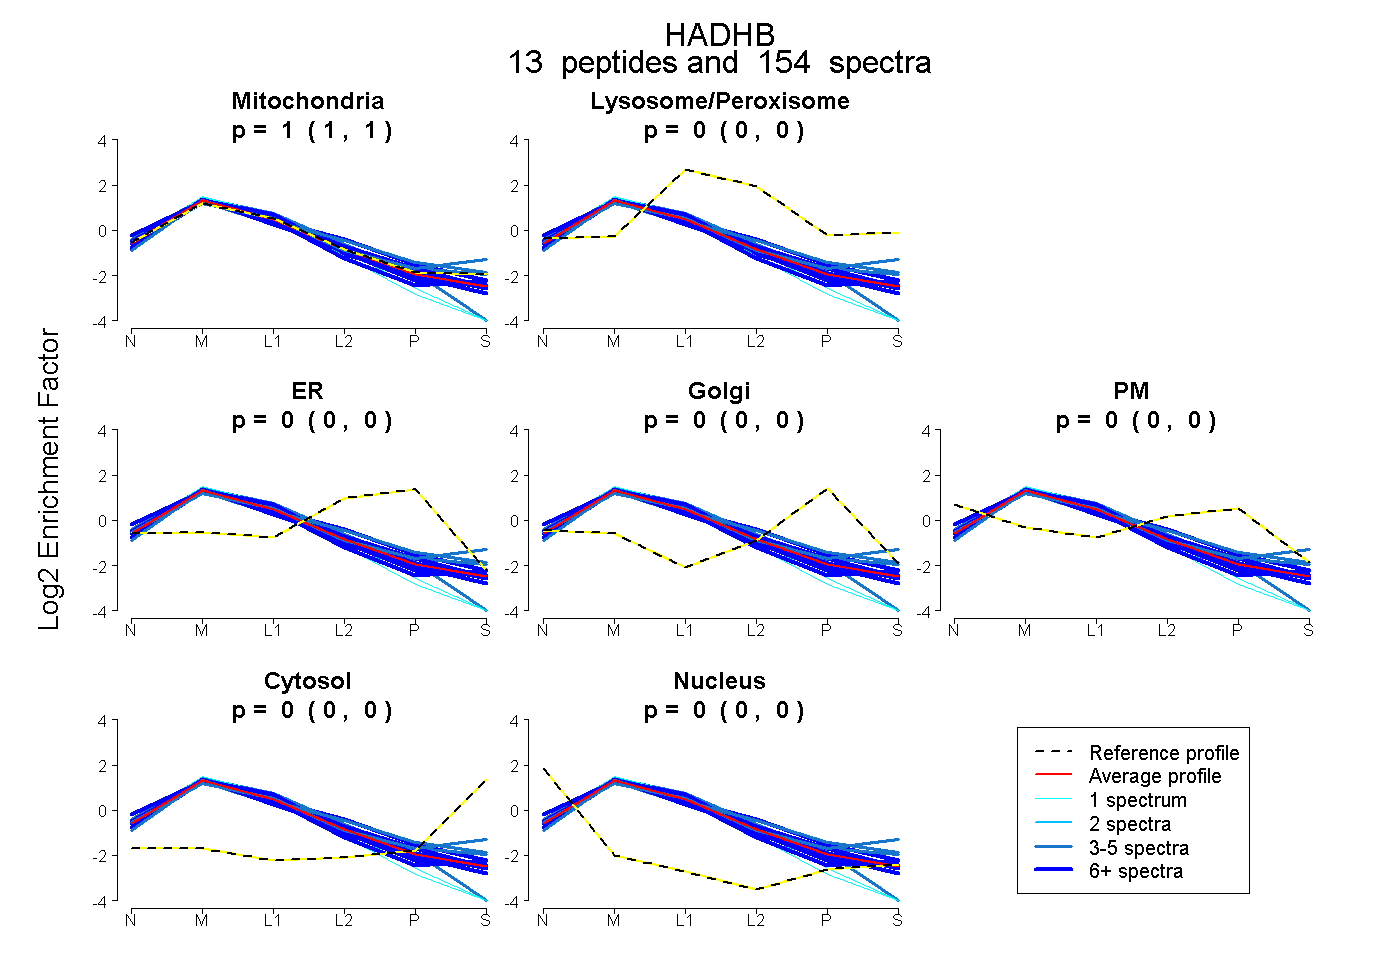 |
0.999 0.998 | 1.000 |
0.000 0.000 | 0.000 |
0.000 0.000 | 0.000 |
0.000 0.000 | 0.000 |
0.000 0.000 | 0.000 |
0.000 0.000 | 0.000 |
0.001 0.000 | 0.002 |
|||
| Plot | Lyso | Other | |||||||||||
| Expt C |
20 peptides |
933 spectra |
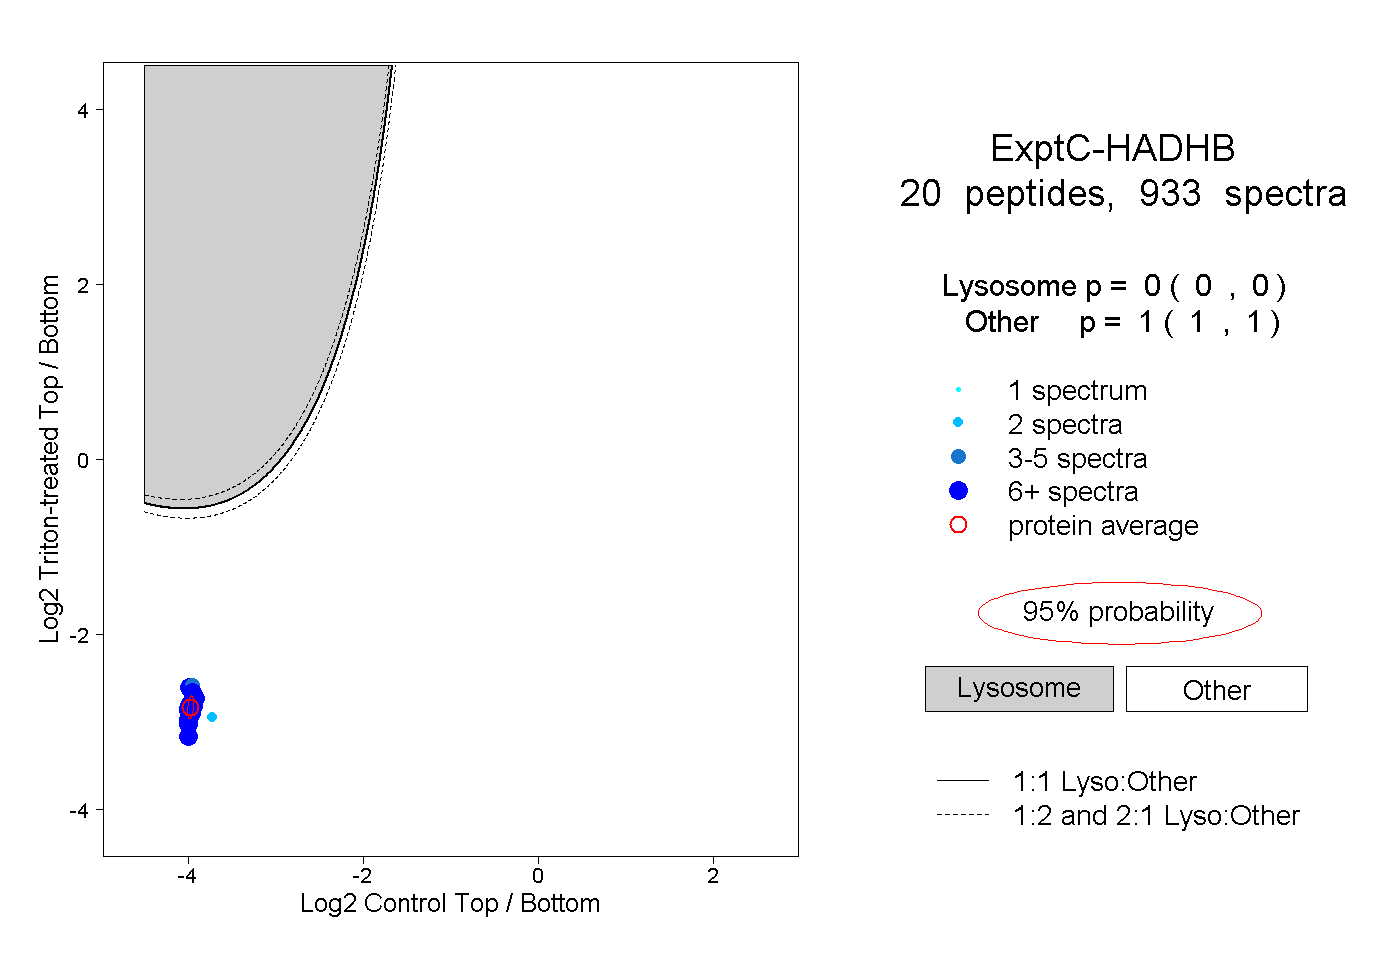 |
0.000 0.000 | 0.000 |
1.000 1.000 | 1.000 |
||||||||
| Plot | Lyso | Other | |||||||||||
| Expt D |
8 peptides |
48 spectra |
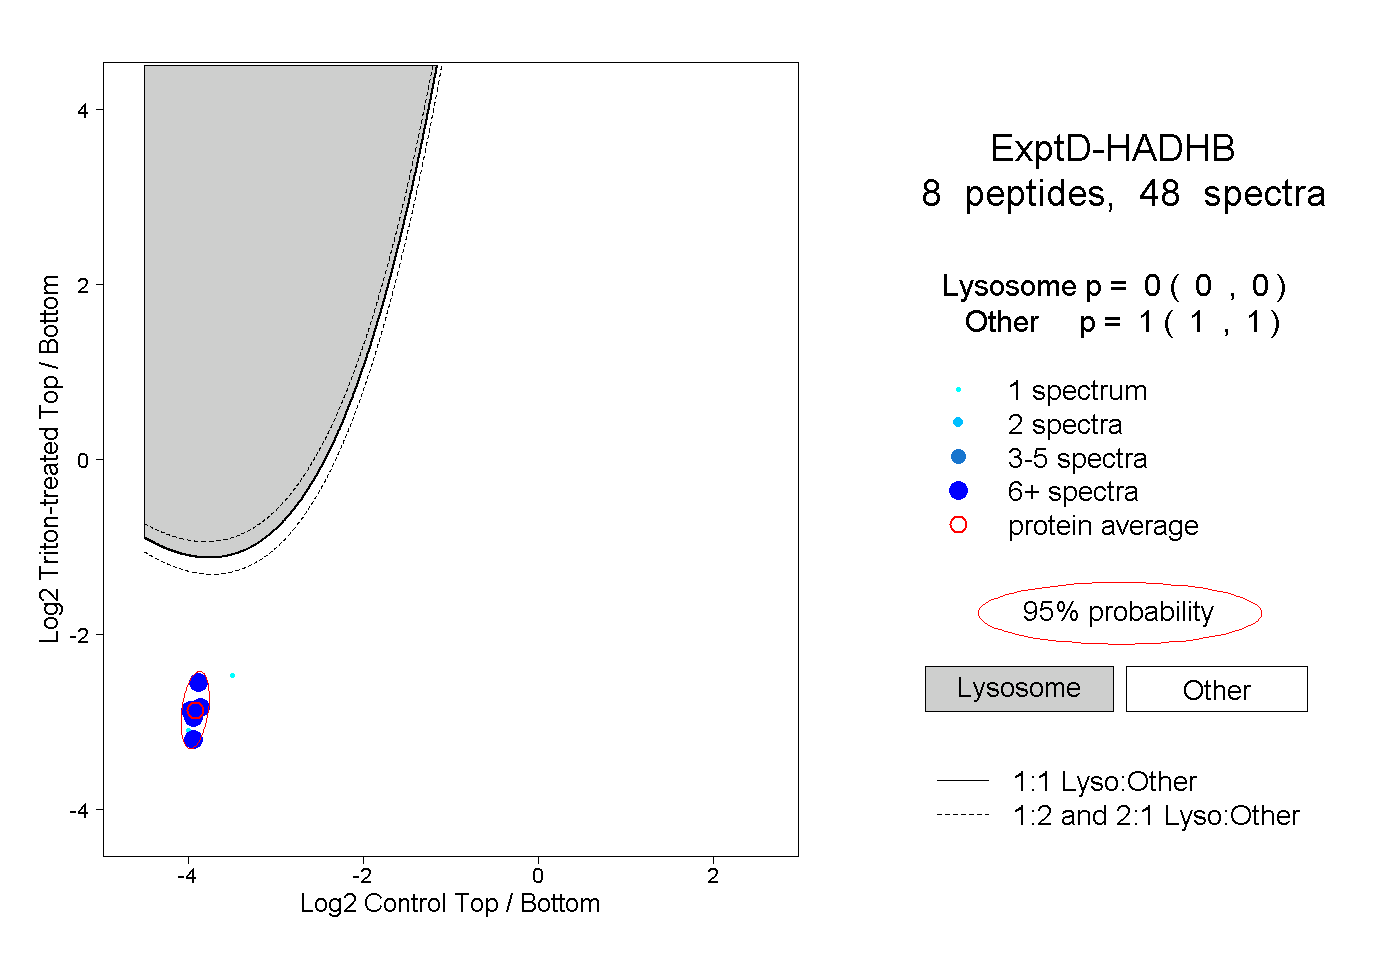 |
0.000 0.000 | 0.000 |
1.000 1.000 | 1.000 |