 9
9peptides
spectra
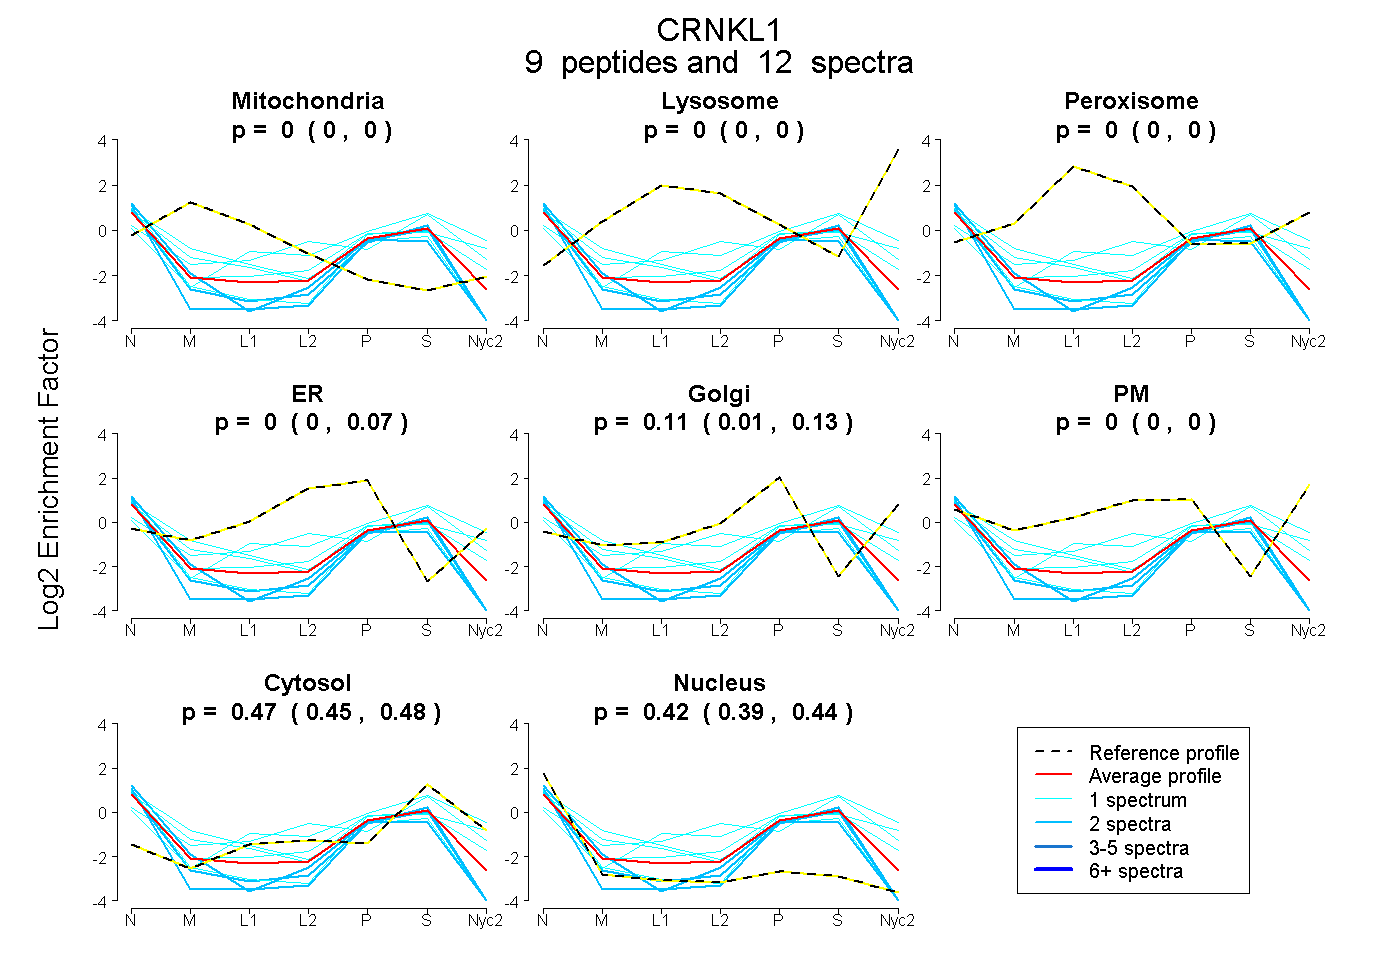
0.000 | 0.000
0.000 | 0.000
0.000 | 0.000
0.000 | 0.073
0.009 | 0.129
0.000 | 0.000
0.454 | 0.485
0.394 | 0.440
| Plot | Mito | Lyso | Perox | ER | Golgi | PM | Cytosol | Nucleus | |||||
| Expt A |
9 peptides |
12 spectra |
|
0.000 0.000 | 0.000 |
0.000 0.000 | 0.000 |
0.000 0.000 | 0.000 |
0.000 0.000 | 0.073 |
0.111 0.009 | 0.129 |
0.000 0.000 | 0.000 |
0.470 0.454 | 0.485 |
0.419 0.394 | 0.440 |
| 1 spectrum, AITTLPR | 0.000 | 0.000 | 0.135 | 0.090 | 0.000 | 0.018 | 0.599 | 0.158 | ||
| 2 spectra, LVESDAEADTVR | 0.000 | 0.000 | 0.000 | 0.000 | 0.000 | 0.000 | 0.348 | 0.652 | ||
| 1 spectrum, ITDEEELNDYK | 0.000 | 0.000 | 0.000 | 0.000 | 0.000 | 0.000 | 0.388 | 0.612 | ||
| 2 spectra, FVLVHPAVK | 0.000 | 0.000 | 0.000 | 0.000 | 0.000 | 0.000 | 0.414 | 0.586 | ||
| 1 spectrum, LMLLESWR | 0.000 | 0.000 | 0.000 | 0.000 | 0.236 | 0.000 | 0.433 | 0.332 | ||
| 2 spectra, NITLWLK | 0.000 | 0.000 | 0.000 | 0.033 | 0.009 | 0.000 | 0.294 | 0.663 | ||
| 1 spectrum, LDMPEVLWK | 0.000 | 0.000 | 0.000 | 0.000 | 0.105 | 0.149 | 0.706 | 0.039 | ||
| 1 spectrum, FAELETILGDIER | 0.234 | 0.000 | 0.000 | 0.059 | 0.000 | 0.000 | 0.291 | 0.415 | ||
| 1 spectrum, QEAQELFK | 0.000 | 0.000 | 0.000 | 0.000 | 0.209 | 0.107 | 0.423 | 0.261 |
| Plot | Mito | Lyso or Perox | ER | Golgi | PM | Cytosol | Nucleus | ||||||
| Expt B |
1 peptide |
1 spectrum |
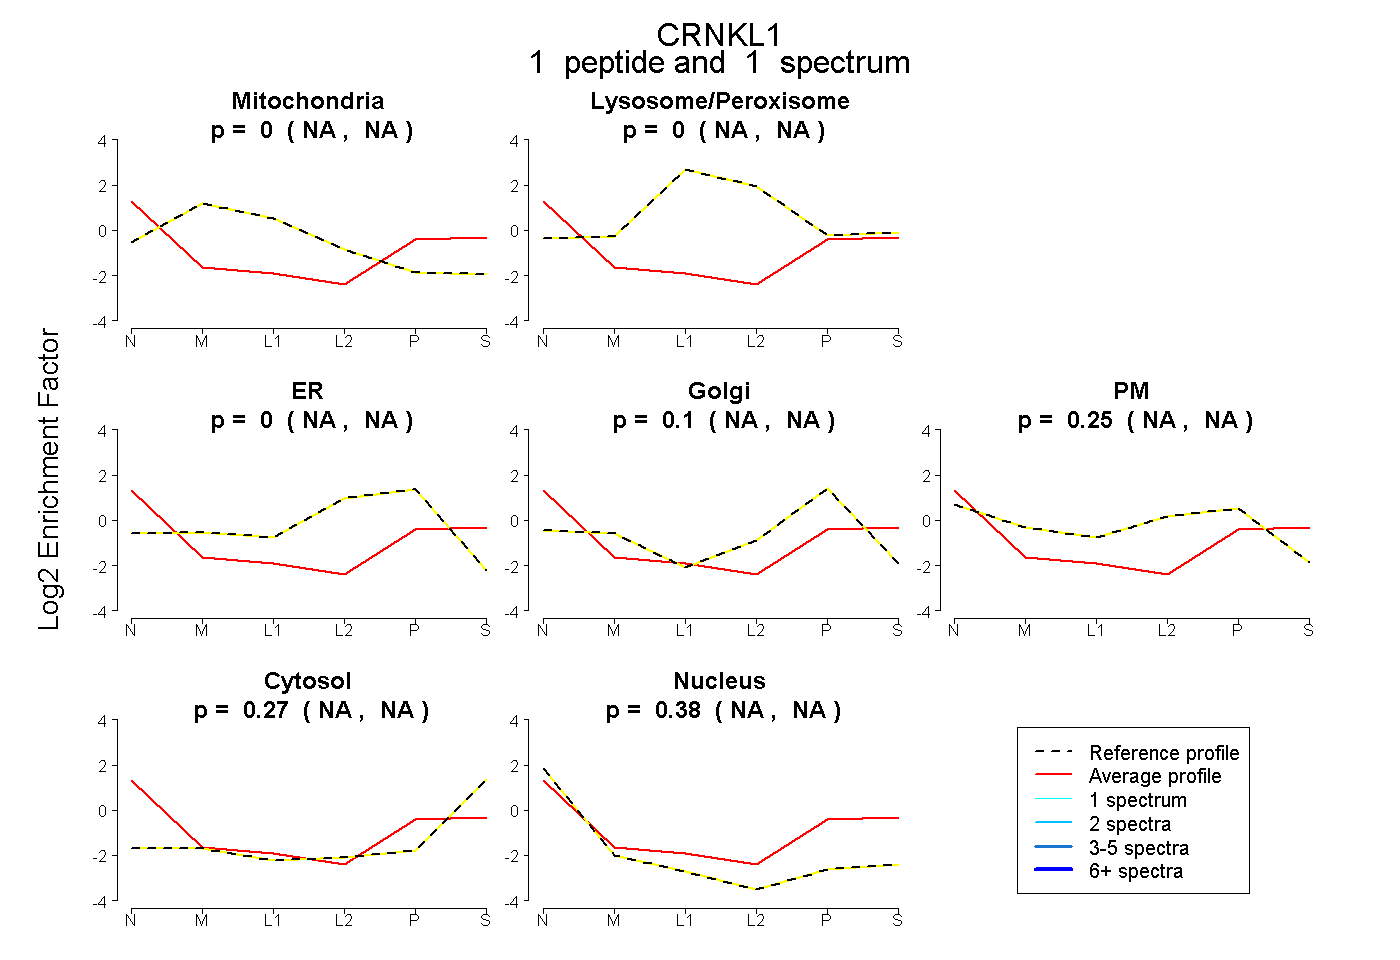 |
0.000 NA | NA |
0.000 NA | NA |
0.000 NA | NA |
0.097 NA | NA |
0.248 NA | NA |
0.272 NA | NA |
0.383 NA | NA |
|||
| Plot | Lyso | Other | |||||||||||
| Expt C |
2 peptides |
8 spectra |
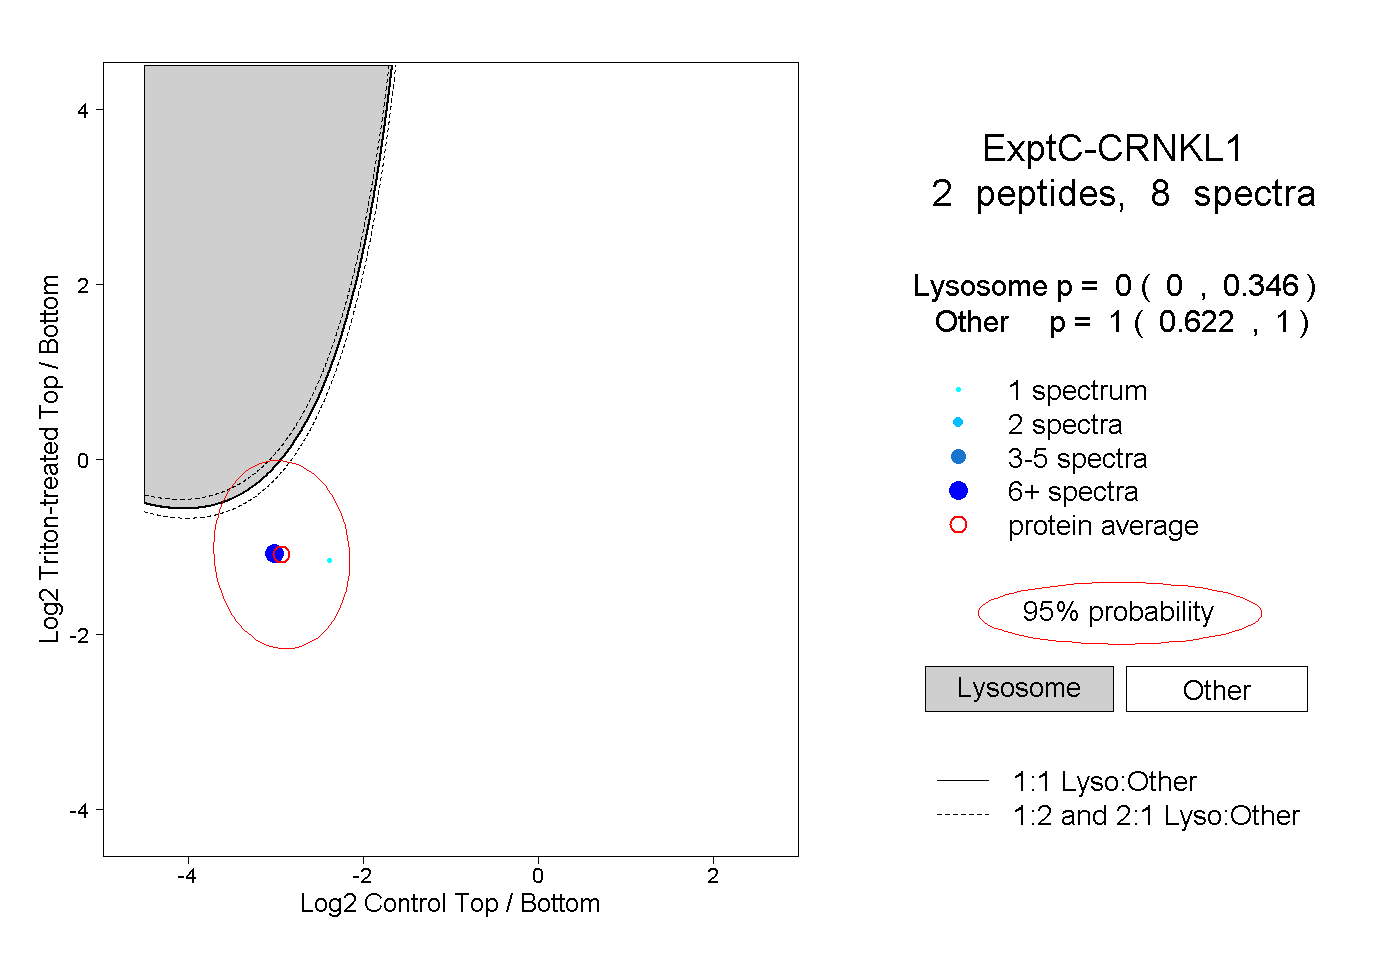 |
0.000 0.000 | 0.346 |
1.000 0.622 | 1.000 |