 2
2peptides
spectra
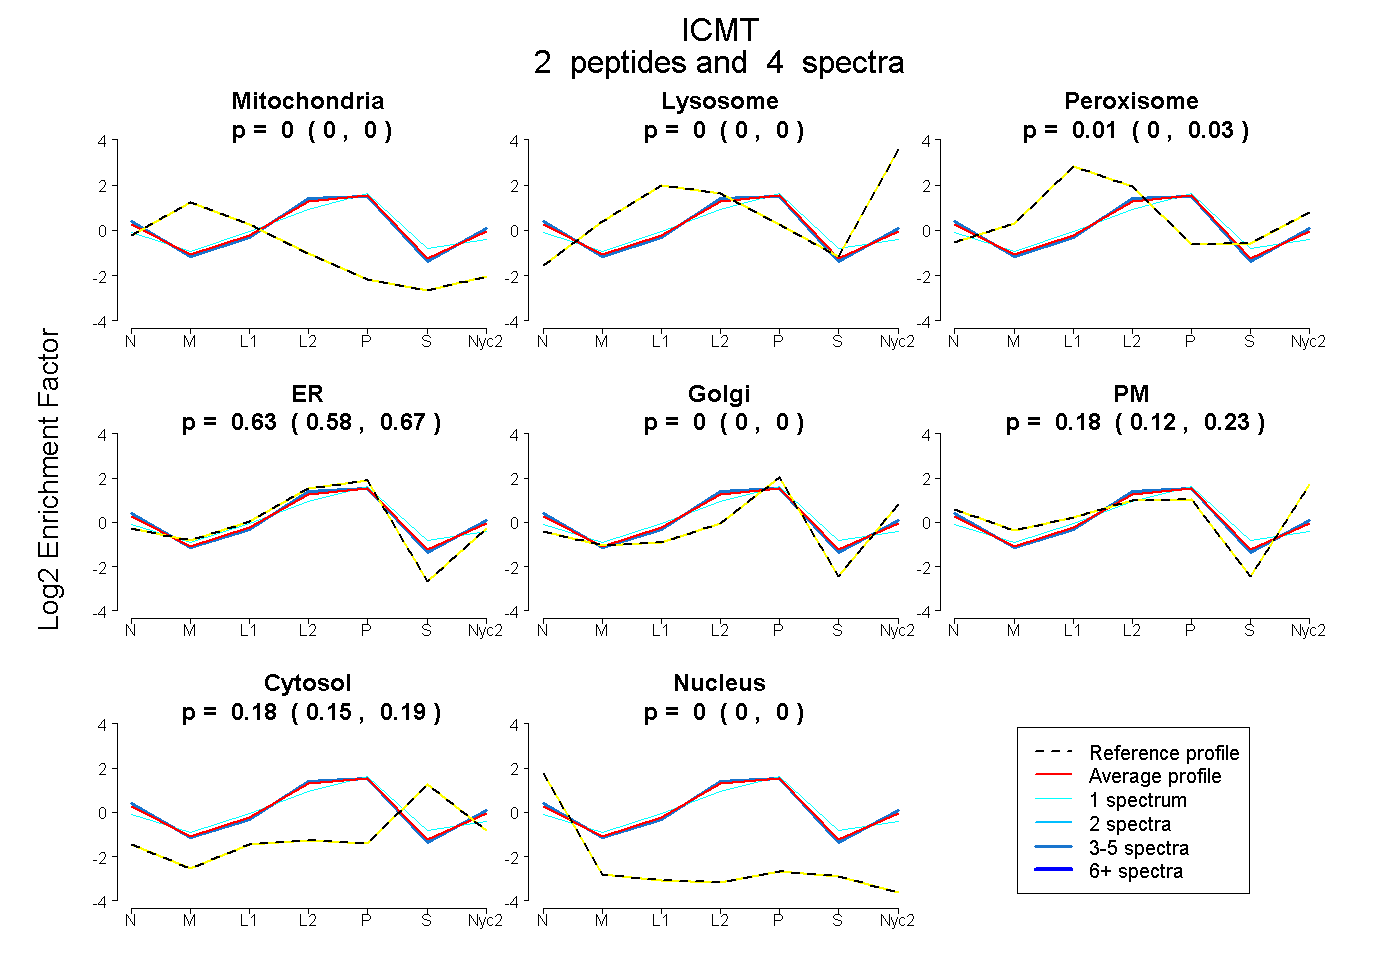
0.000 | 0.000
0.000 | 0.000
0.000 | 0.032
0.579 | 0.673
0.000 | 0.000
0.125 | 0.232
0.153 | 0.193
0.000 | 0.000
1peptide
spectrum
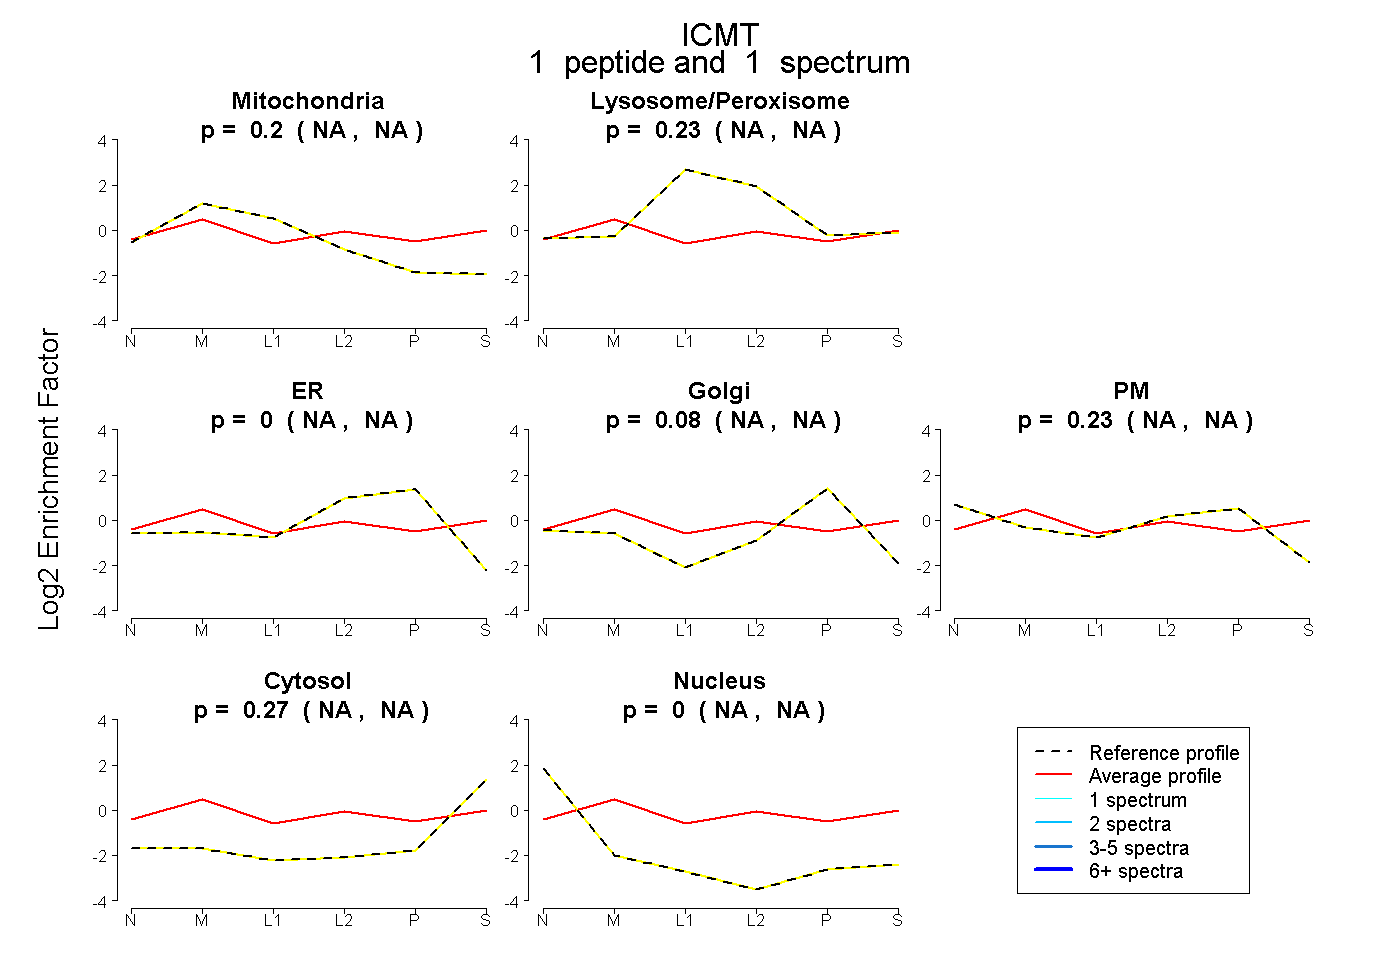
NA | NA
NA | NA
NA | NA
NA | NA
NA | NA
NA | NA
NA | NA
2peptides
spectra
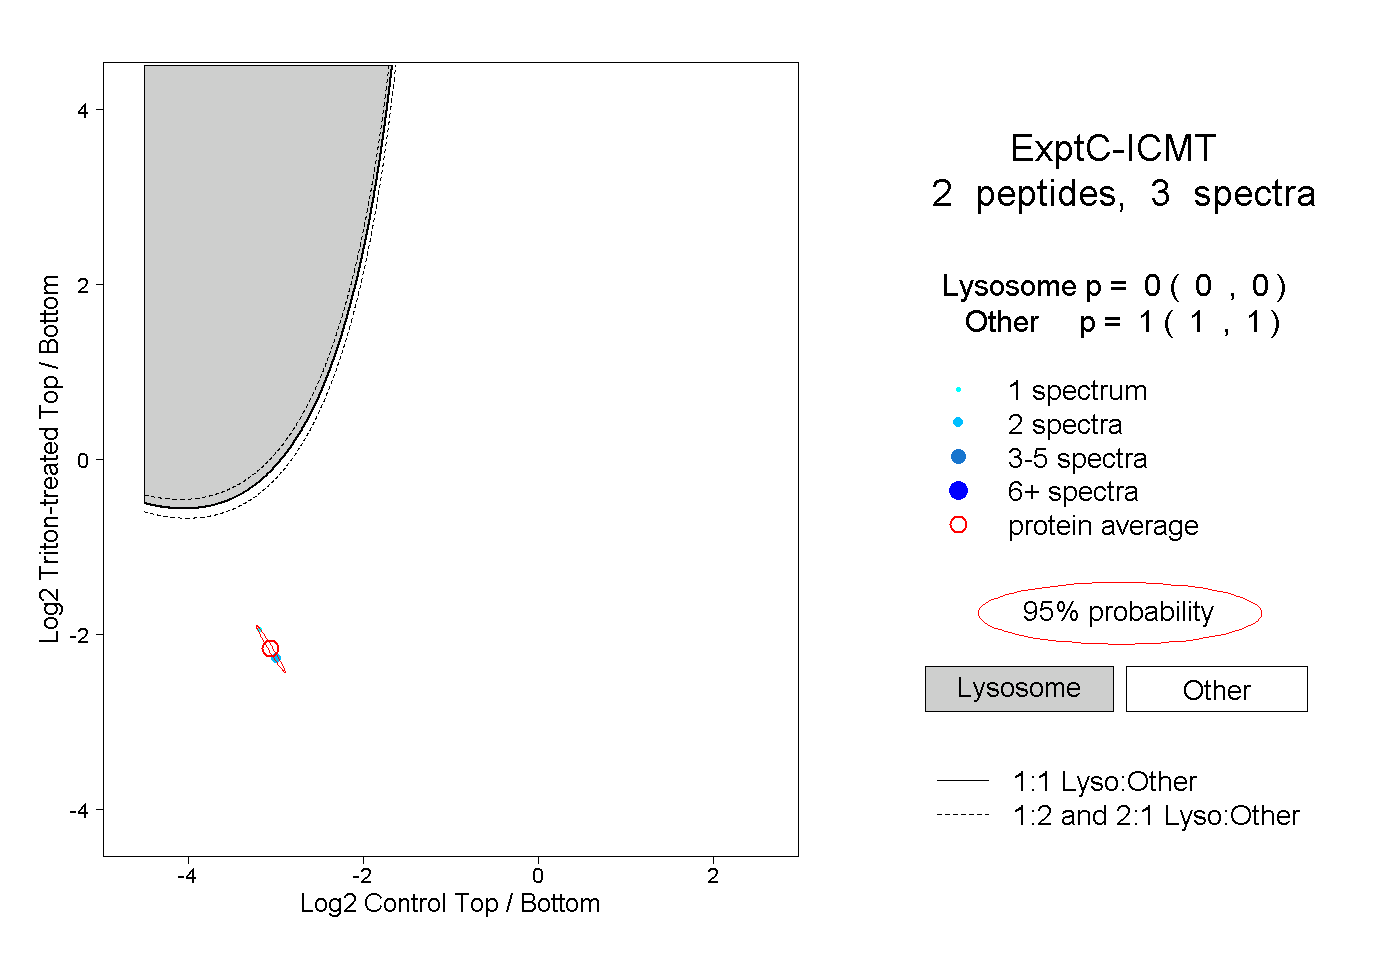
0.000 | 0.000
1.000 | 1.000