 3
3peptides
spectra
0.000 | 0.000
0.135 | 0.471
0.000 | 0.186
0.000 | 0.337
0.000 | 0.516
0.000 | 0.329
0.000 | 0.222
0.000 | 0.000
| Plot | Mito | Lyso | Perox | ER | Golgi | PM | Cytosol | Nucleus | |||||
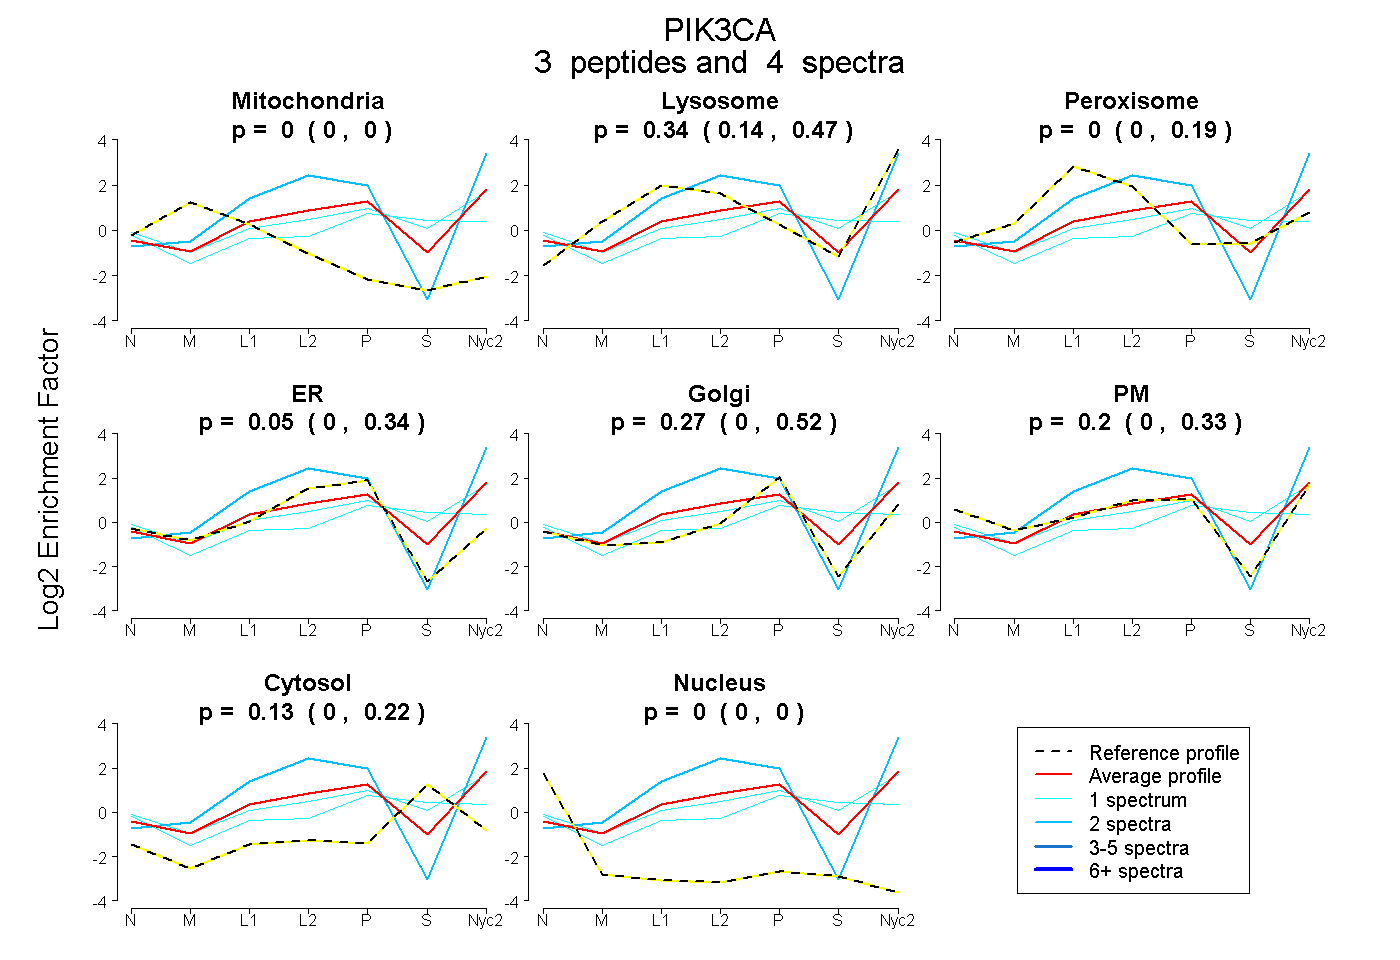
| Expt A |
3 peptides |
4 spectra |
|
0.000 0.000 | 0.000 |
0.344 0.135 | 0.471 |
0.000 0.000 | 0.186 |
0.055 0.000 | 0.337 |
0.274 0.000 | 0.516 |
0.199 0.000 | 0.329 |
0.128 0.000 | 0.222 |
0.000 0.000 | 0.000 |
| 1 spectrum, YPLSQYK | 0.000 | 0.004 | 0.130 | 0.000 | 0.274 | 0.134 | 0.459 | 0.000 | ||
| 2 spectra, LLLSVK | 0.000 | 0.546 | 0.000 | 0.169 | 0.000 | 0.285 | 0.000 | 0.000 | ||
| 1 spectrum, LFQPFLK | 0.000 | 0.271 | 0.000 | 0.000 | 0.056 | 0.369 | 0.304 | 0.000 |
| Plot | Lyso | Other | |||||||||||
| Expt C |
6 peptides |
18 spectra |
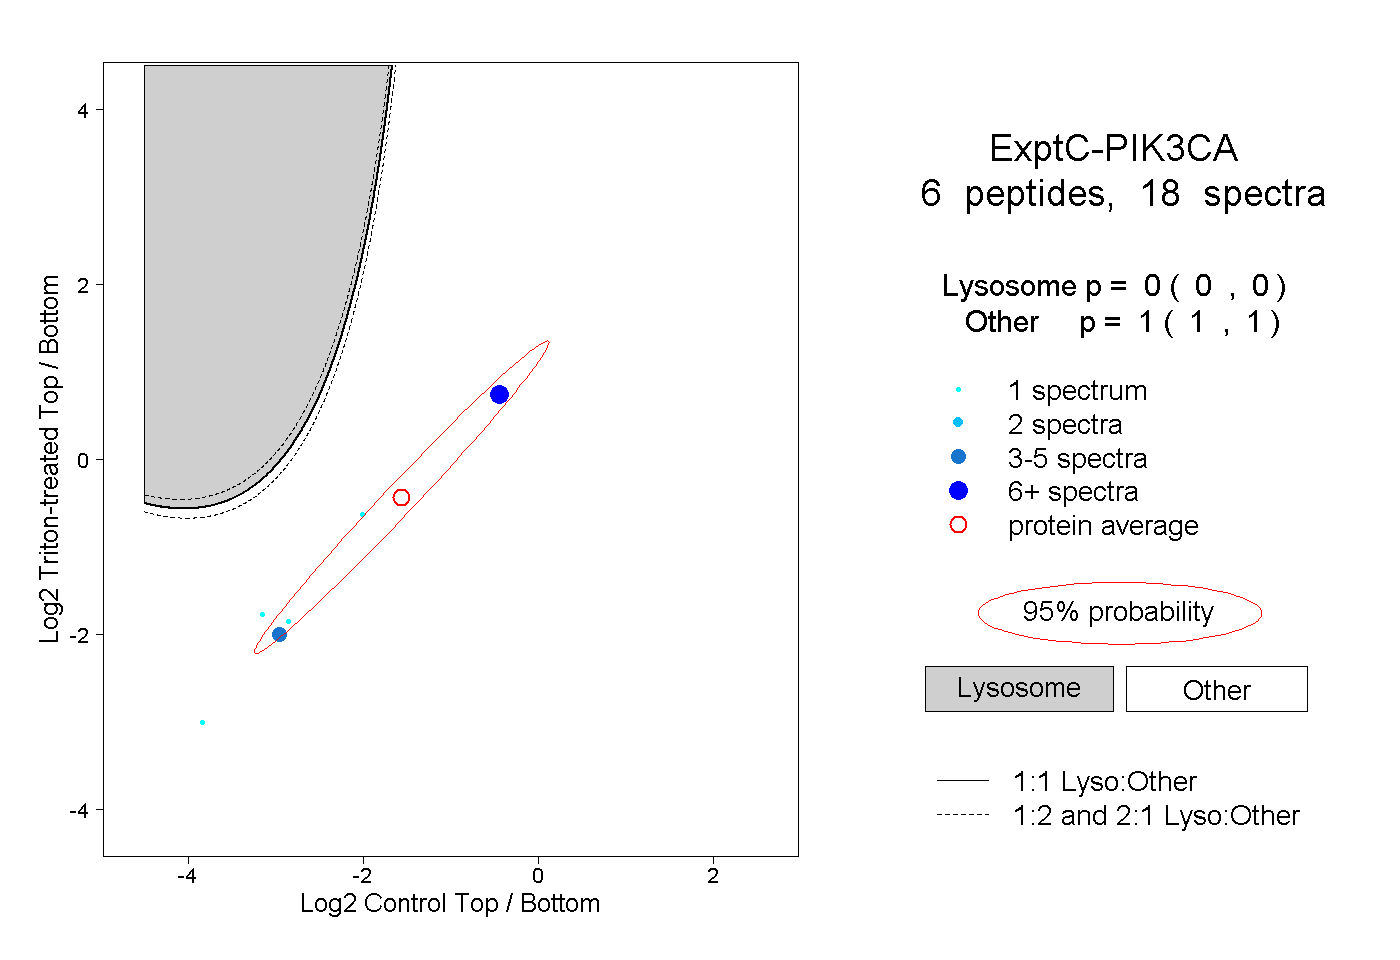 |
0.000 0.000 | 0.000 |
1.000 1.000 | 1.000 |
||||||||
| Plot | Lyso | Other | |||||||||||
| Expt D |
1 peptide |
1 spectrum |
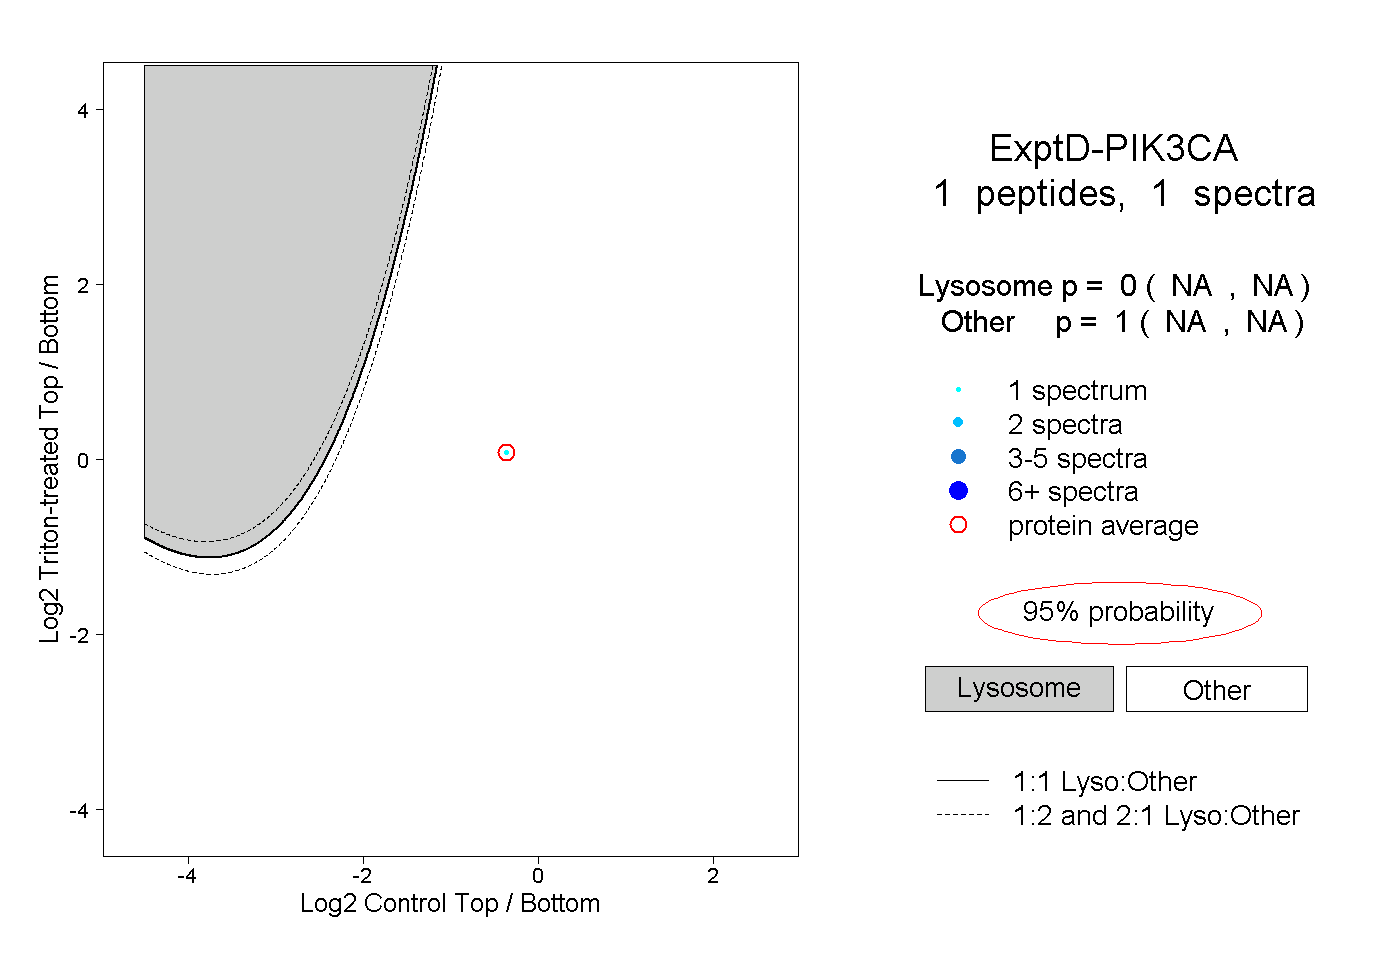 |
0.000 NA | NA |
1.000 NA | NA |