 17
17peptides
spectra
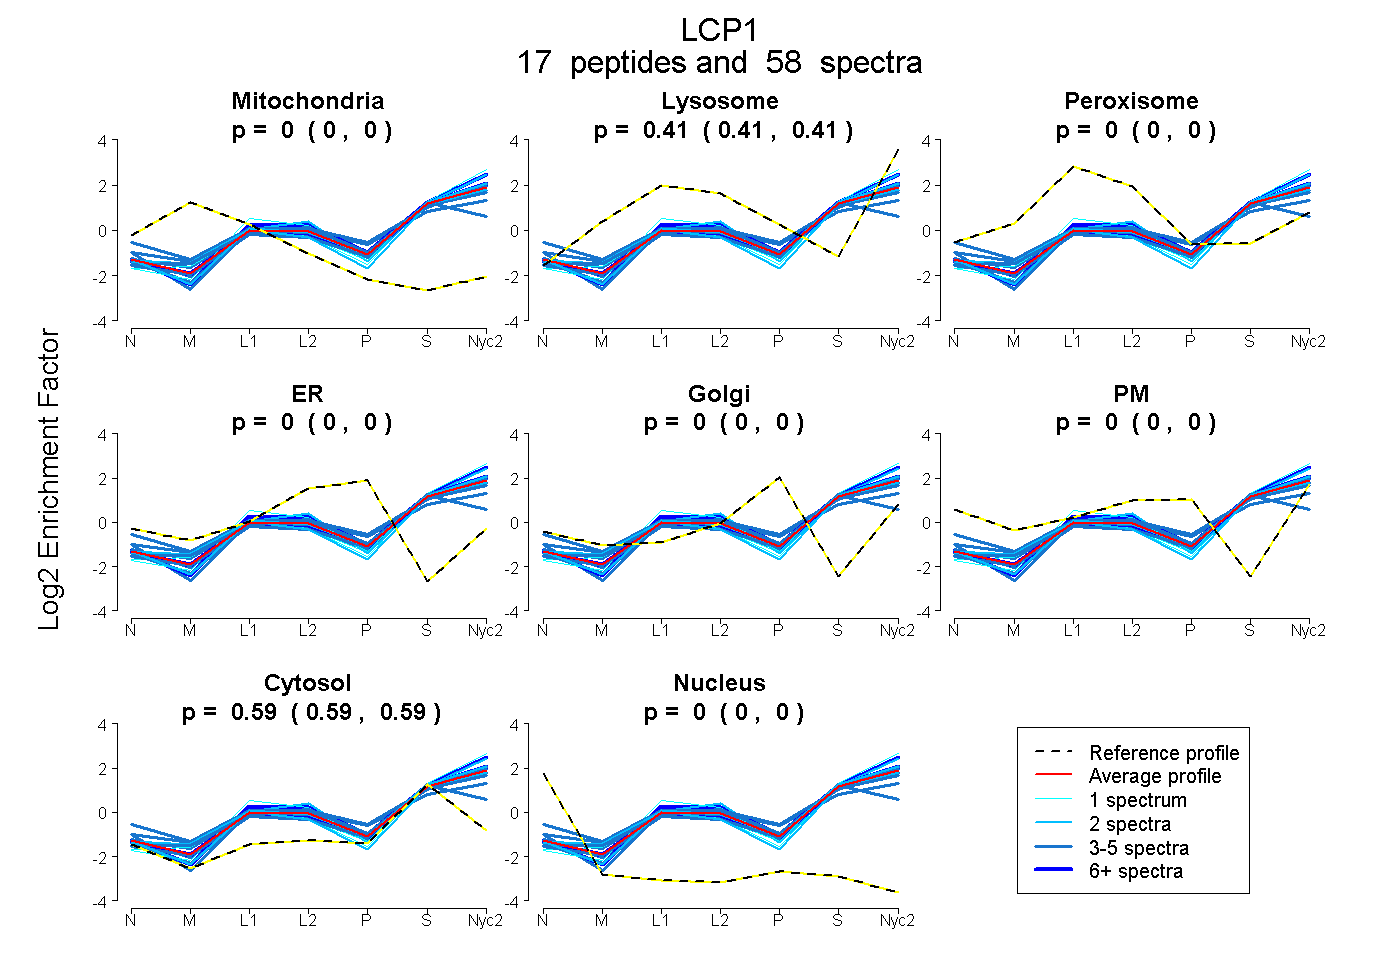
0.000 | 0.000
0.406 | 0.411
0.000 | 0.000
0.000 | 0.000
0.000 | 0.000
0.000 | 0.000
0.588 | 0.594
0.000 | 0.000
3peptides
spectra
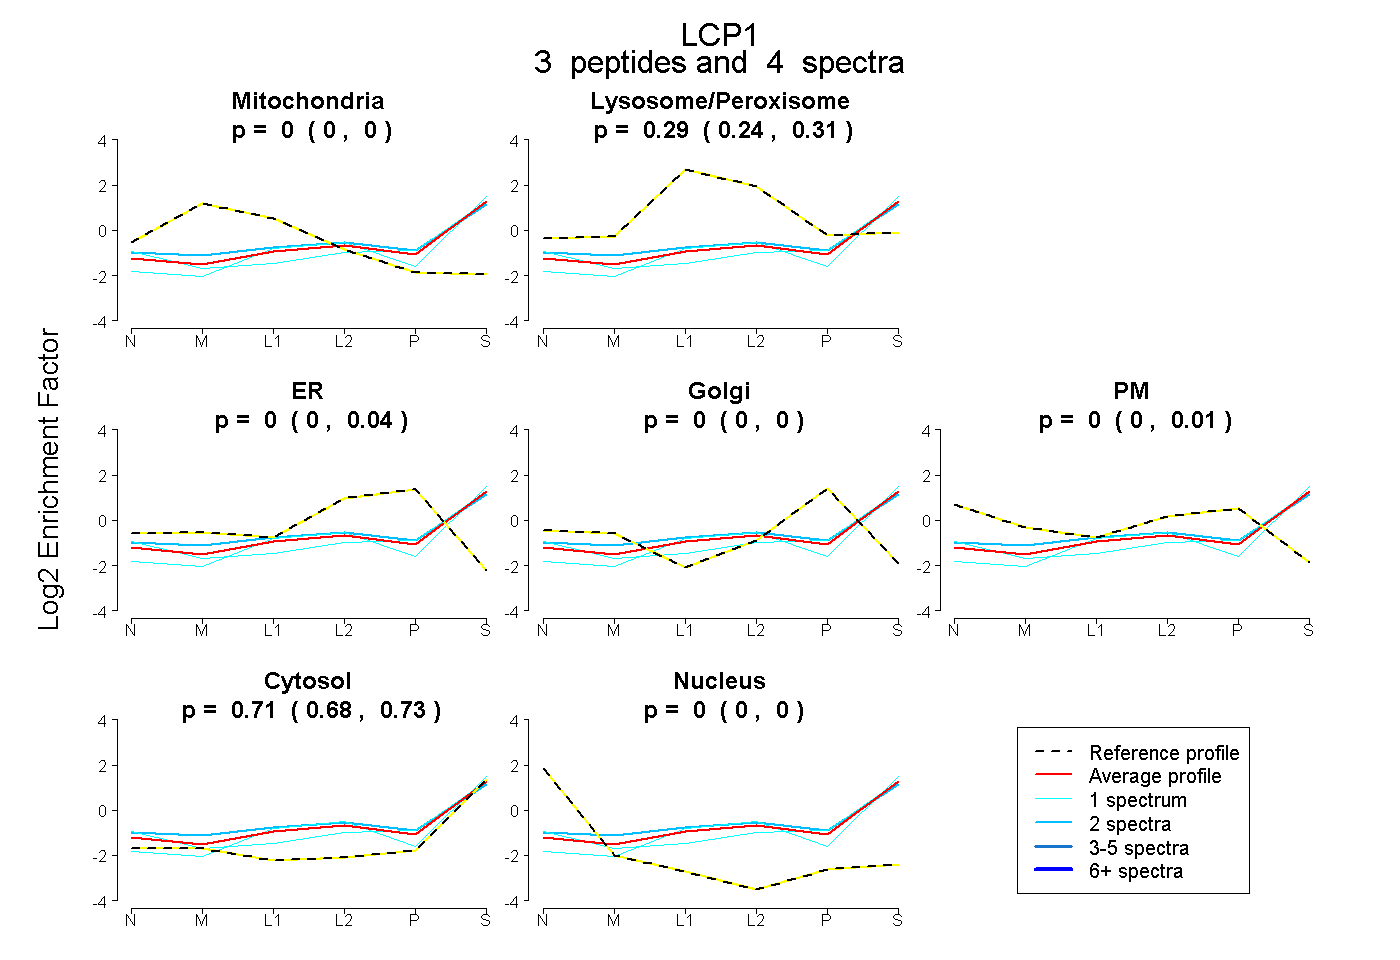
0.000 | 0.000
0.245 | 0.309
0.000 | 0.038
0.000 | 0.000
0.000 | 0.005
0.678 | 0.732
0.000 | 0.000
19peptides
spectra
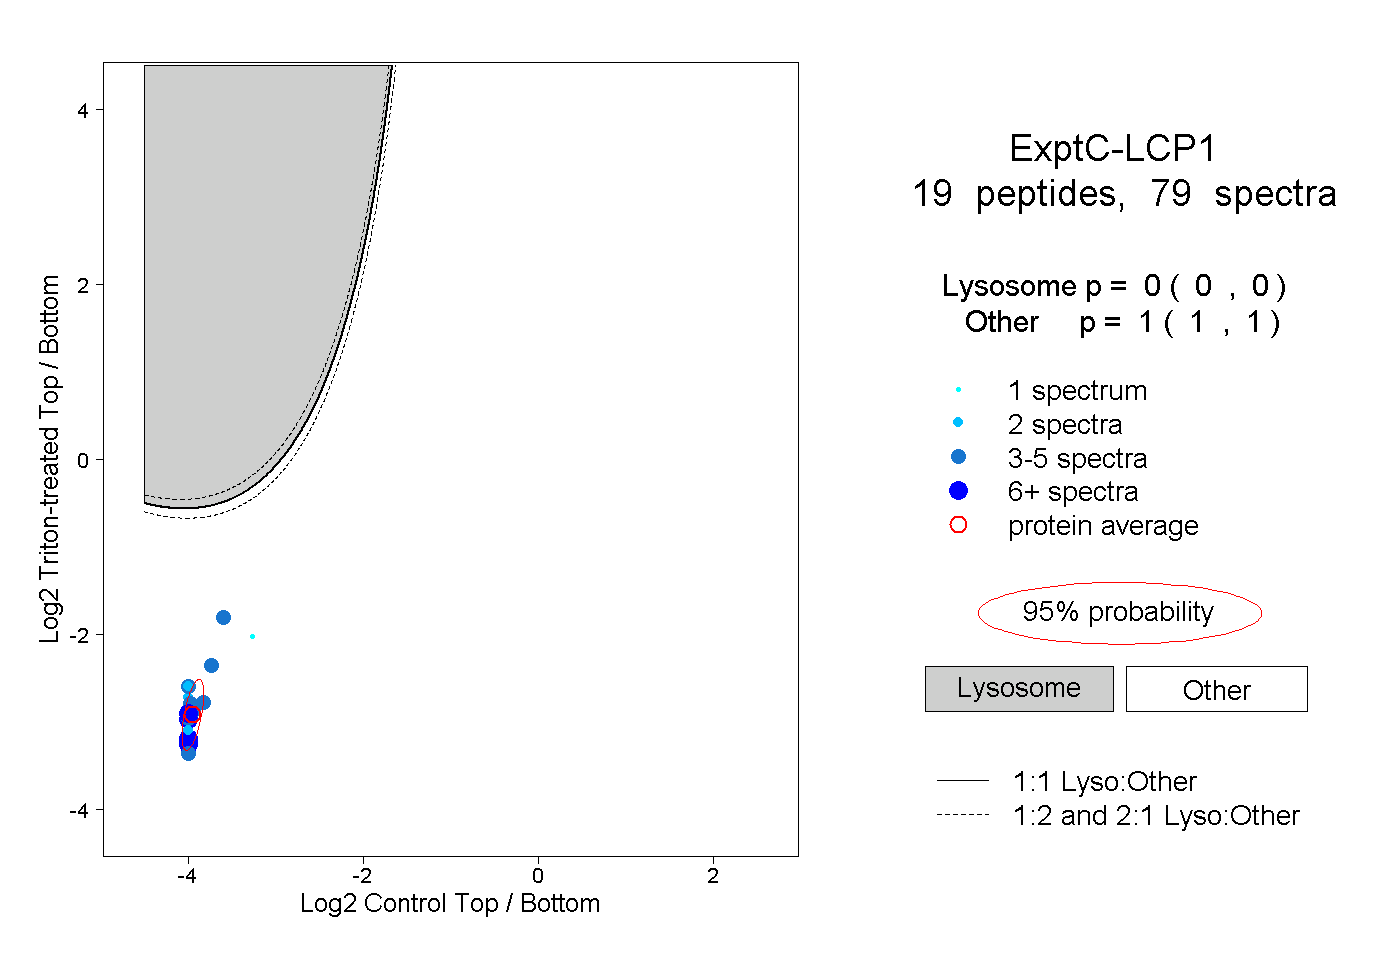
0.000 | 0.000
1.000 | 1.000
4peptides
spectra
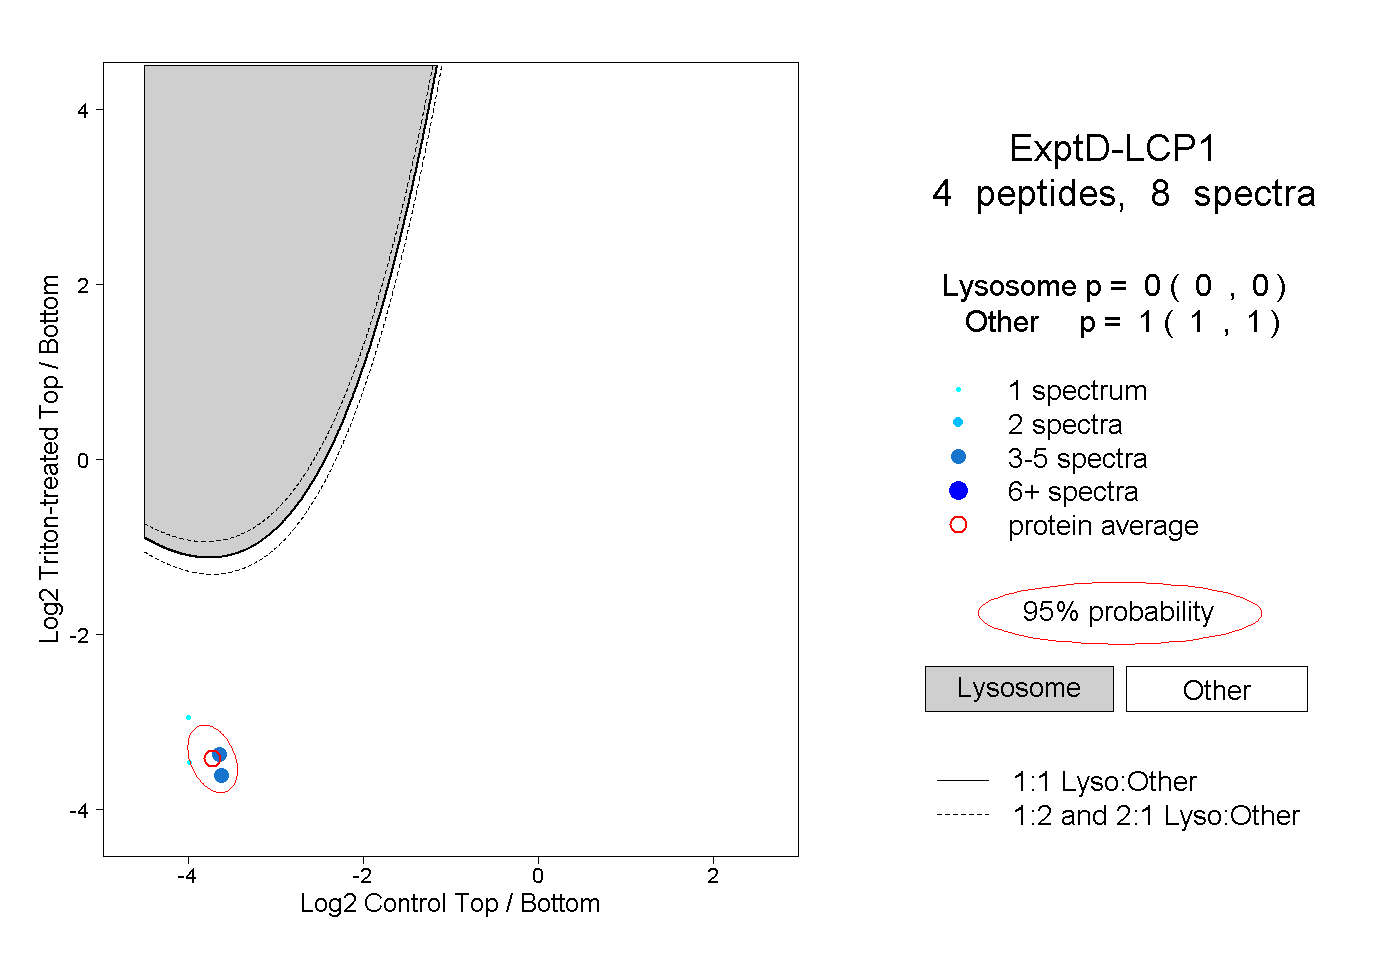
0.000 | 0.000
1.000 | 1.000