10
10peptides
spectra
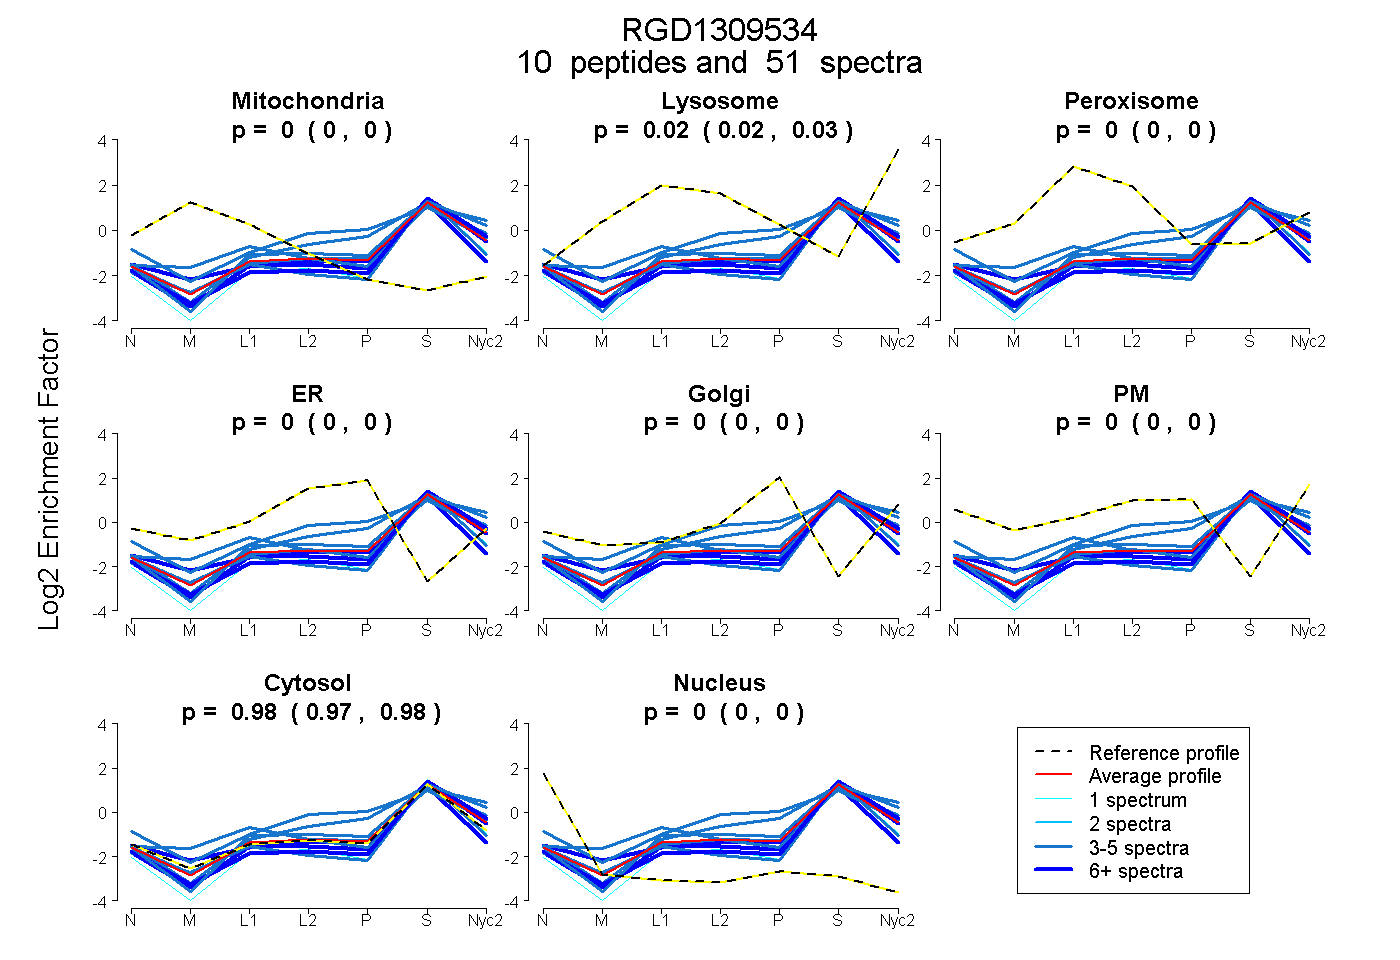
0.000 | 0.000
0.017 | 0.029
0.000 | 0.000
0.000 | 0.000
0.000 | 0.000
0.000 | 0.000
0.970 | 0.982
0.000 | 0.000
7peptides
spectra
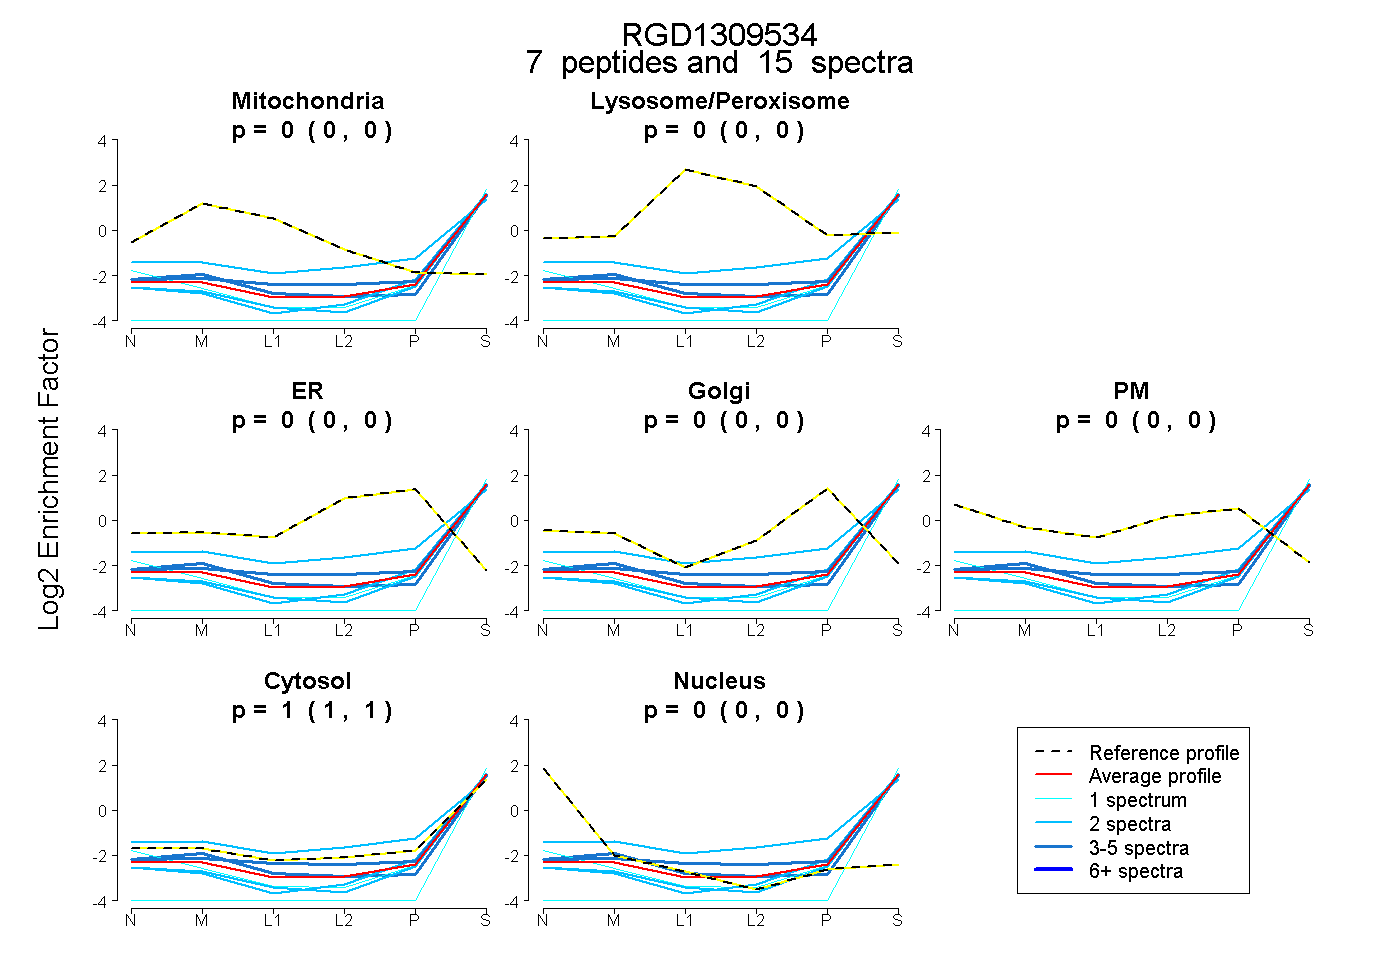
0.000 | 0.000
0.000 | 0.000
0.000 | 0.000
0.000 | 0.000
0.000 | 0.000
1.000 | 1.000
0.000 | 0.000