 10
10peptides
spectra
0.000 | 0.000
0.017 | 0.029
0.000 | 0.000
0.000 | 0.000
0.000 | 0.000
0.000 | 0.000
0.970 | 0.982
0.000 | 0.000
| Plot | Mito | Lyso | Perox | ER | Golgi | PM | Cytosol | Nucleus | |||||
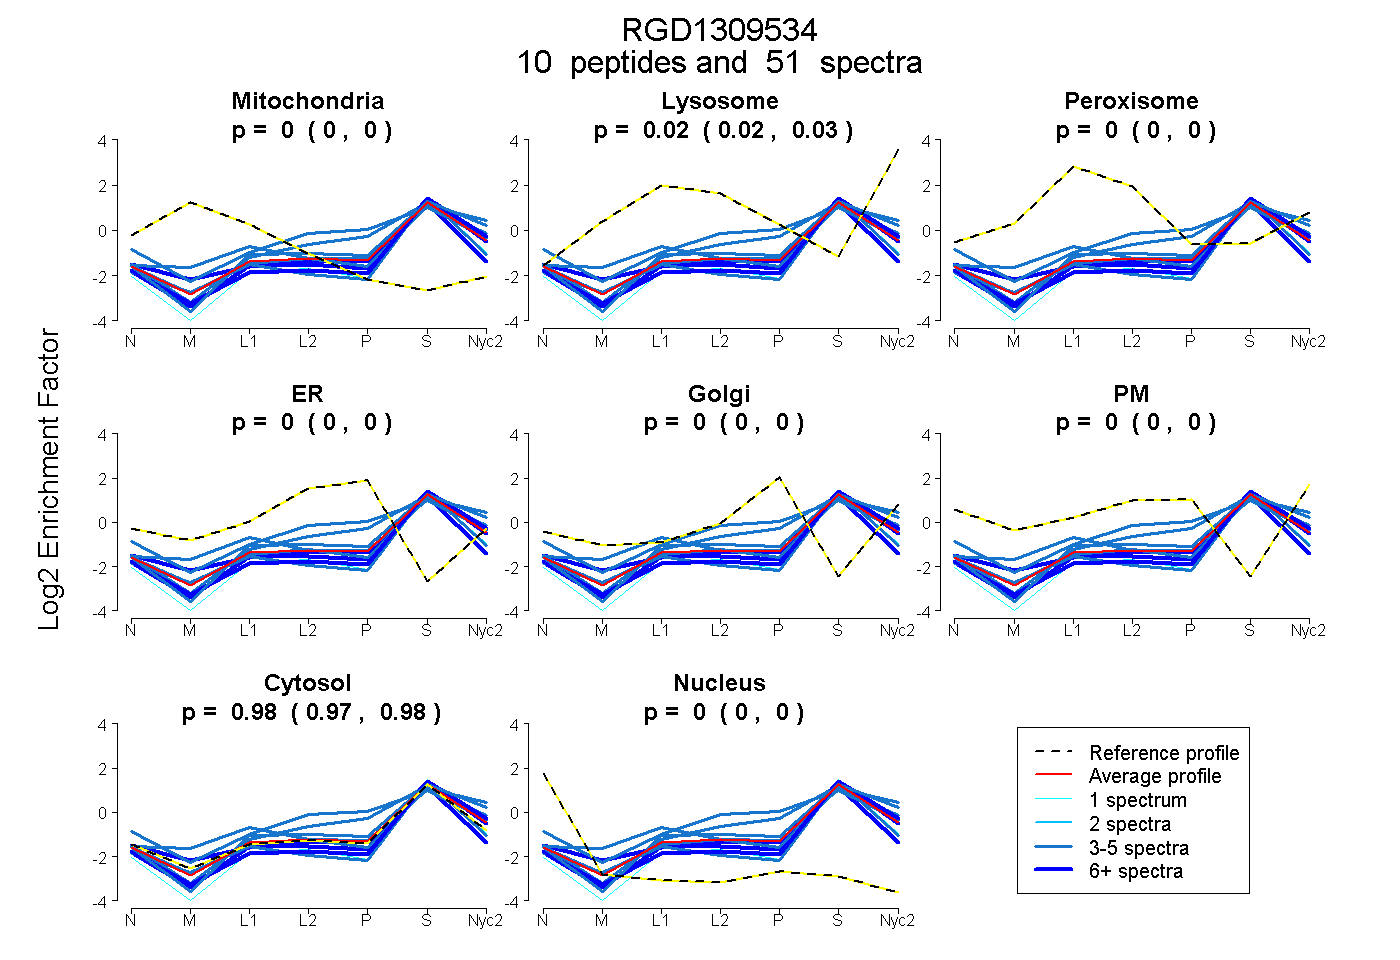
| Expt A |
10 peptides |
51 spectra |
|
0.000 0.000 | 0.000 |
0.024 0.017 | 0.029 |
0.000 0.000 | 0.000 |
0.000 0.000 | 0.000 |
0.000 0.000 | 0.000 |
0.000 0.000 | 0.000 |
0.976 0.970 | 0.982 |
0.000 0.000 | 0.000 |
| 3 spectra, HYGDKPVGMGGTFLVQK | 0.000 | 0.089 | 0.000 | 0.000 | 0.000 | 0.000 | 0.911 | 0.000 | ||
| 5 spectra, GICGQTR | 0.000 | 0.000 | 0.000 | 0.000 | 0.000 | 0.000 | 0.974 | 0.026 | ||
| 7 spectra, VIEVQAK | 0.000 | 0.000 | 0.000 | 0.000 | 0.000 | 0.000 | 1.000 | 0.000 | ||
| 5 spectra, EPFTFPVK | 0.000 | 0.007 | 0.000 | 0.053 | 0.075 | 0.000 | 0.864 | 0.000 | ||
| 5 spectra, TGEHNFVSCMR | 0.040 | 0.145 | 0.000 | 0.000 | 0.000 | 0.000 | 0.816 | 0.000 | ||
| 7 spectra, APLVCLPVFVSK | 0.039 | 0.000 | 0.000 | 0.000 | 0.000 | 0.000 | 0.933 | 0.028 | ||
| 10 spectra, ANPADGK | 0.000 | 0.000 | 0.000 | 0.000 | 0.000 | 0.000 | 1.000 | 0.000 | ||
| 4 spectra, ETHAFGR | 0.000 | 0.049 | 0.000 | 0.225 | 0.000 | 0.000 | 0.725 | 0.000 | ||
| 1 spectrum, DPGLDLR | 0.000 | 0.000 | 0.000 | 0.000 | 0.000 | 0.000 | 0.994 | 0.006 | ||
| 4 spectra, VYDLNEIAK | 0.000 | 0.070 | 0.000 | 0.000 | 0.000 | 0.000 | 0.930 | 0.000 |
| Plot | Mito | Lyso or Perox | ER | Golgi | PM | Cytosol | Nucleus | ||||||
| Expt B |
7 peptides |
15 spectra |
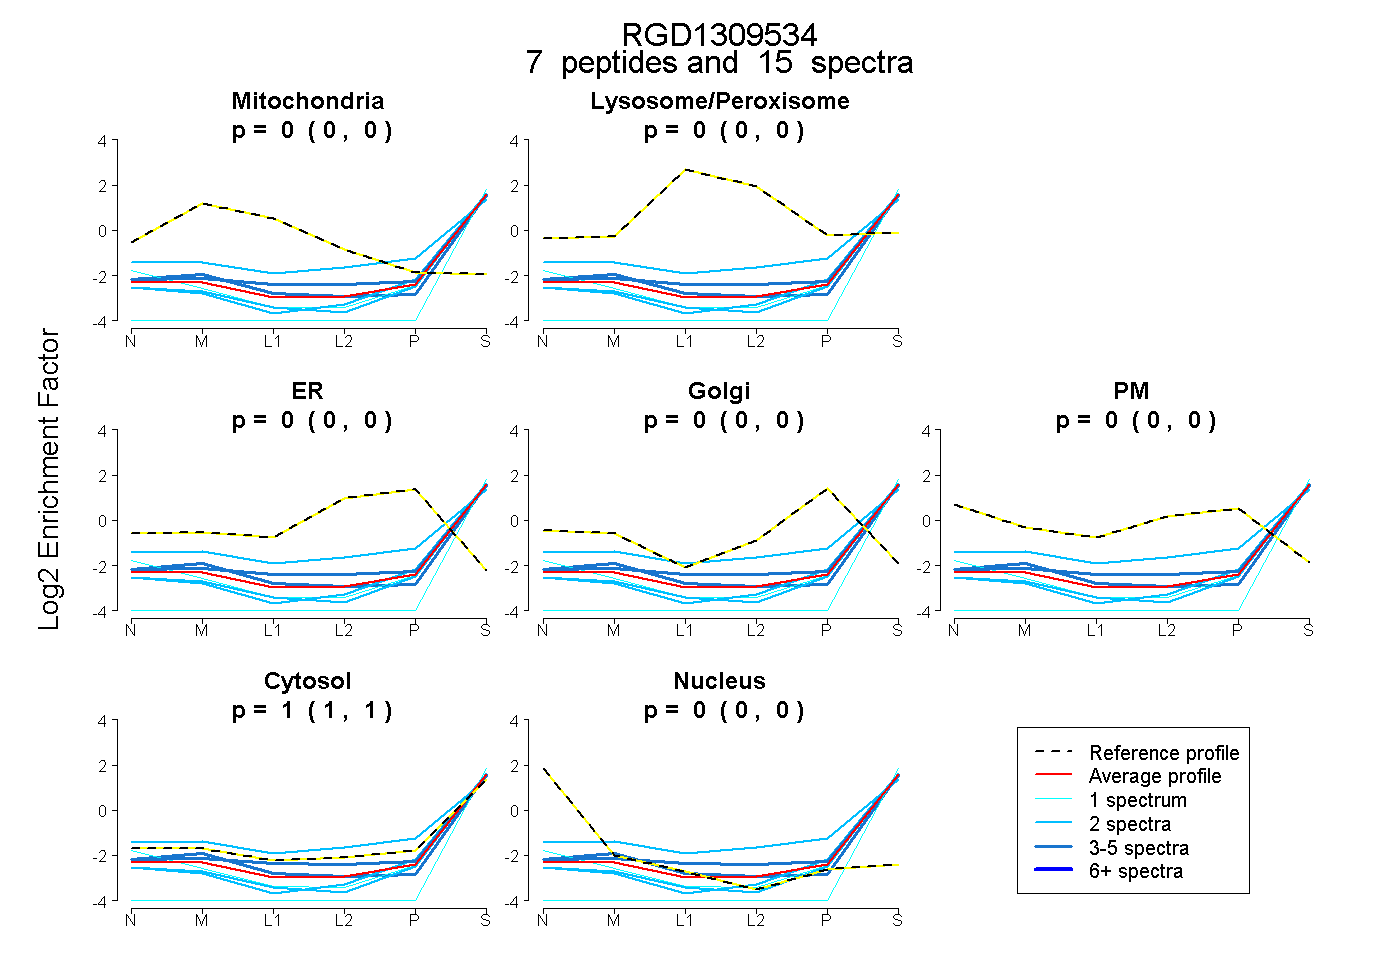 |
0.000 0.000 | 0.000 |
0.000 0.000 | 0.000 |
0.000 0.000 | 0.000 |
0.000 0.000 | 0.000 |
0.000 0.000 | 0.000 |
1.000 1.000 | 1.000 |
0.000 0.000 | 0.000 |
|||
| Plot | Lyso | Other | |||||||||||
| Expt C |
11 peptides |
75 spectra |
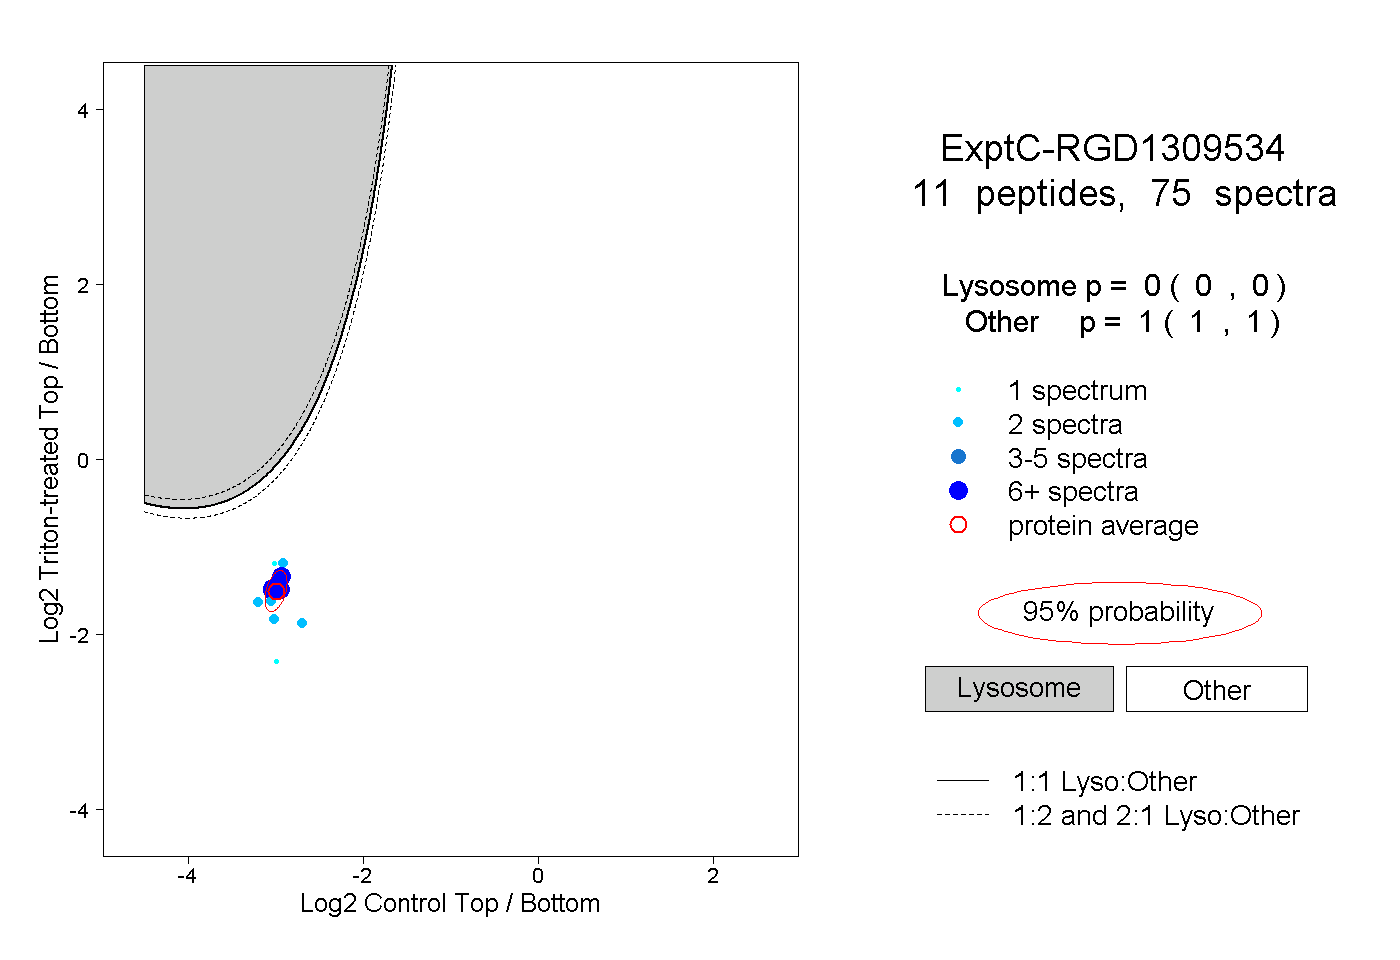 |
0.000 0.000 | 0.000 |
1.000 1.000 | 1.000 |
||||||||
| Plot | Lyso | Other | |||||||||||
| Expt D |
4 peptides |
8 spectra |
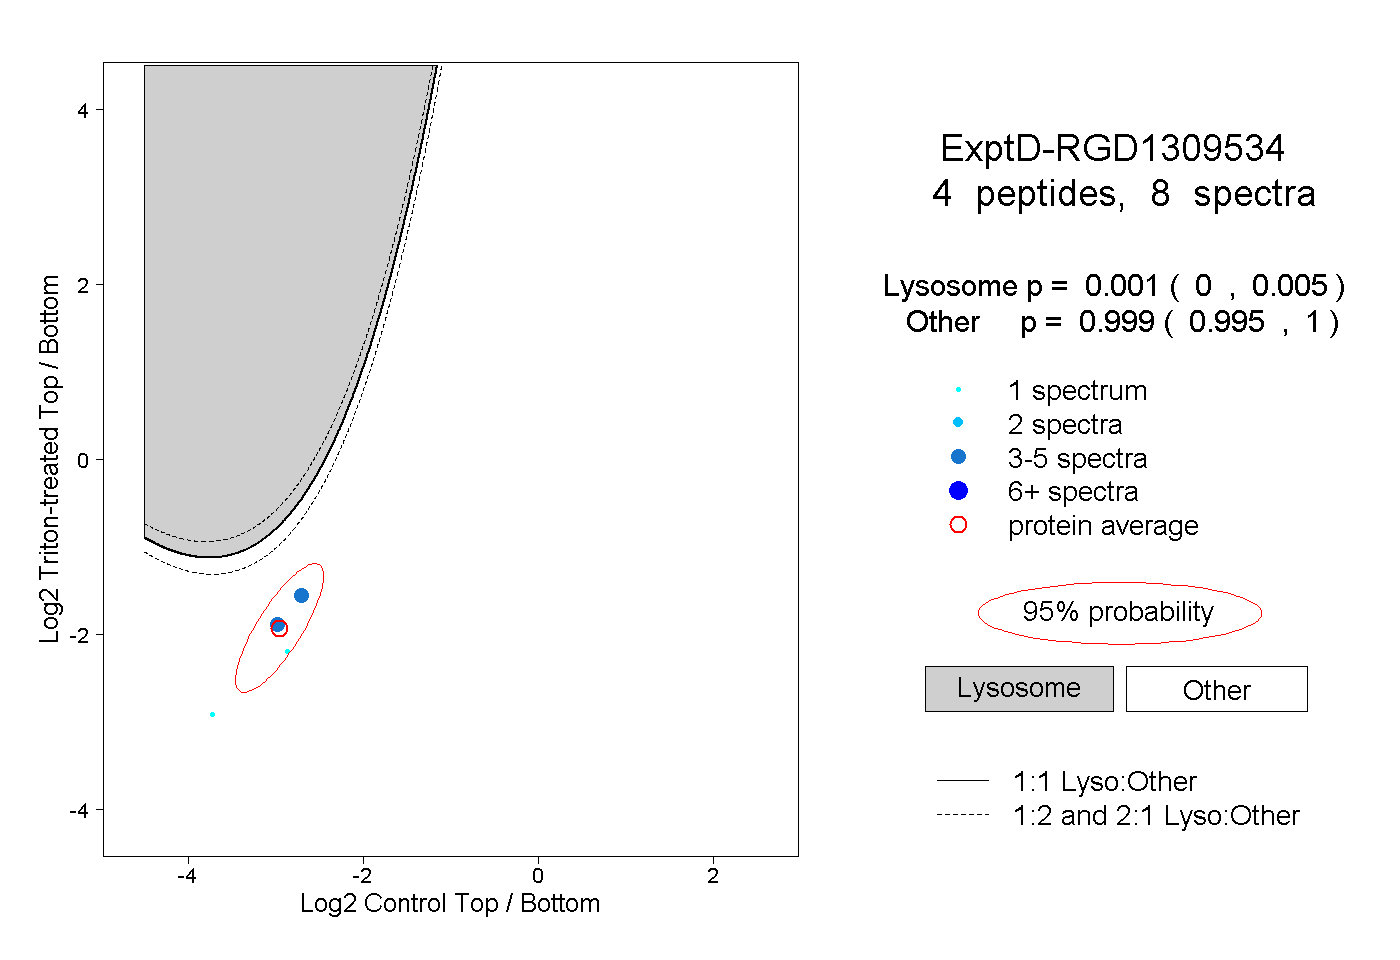 |
0.001 0.000 | 0.005 |
0.999 0.995 | 1.000 |