 3
3peptides
spectra
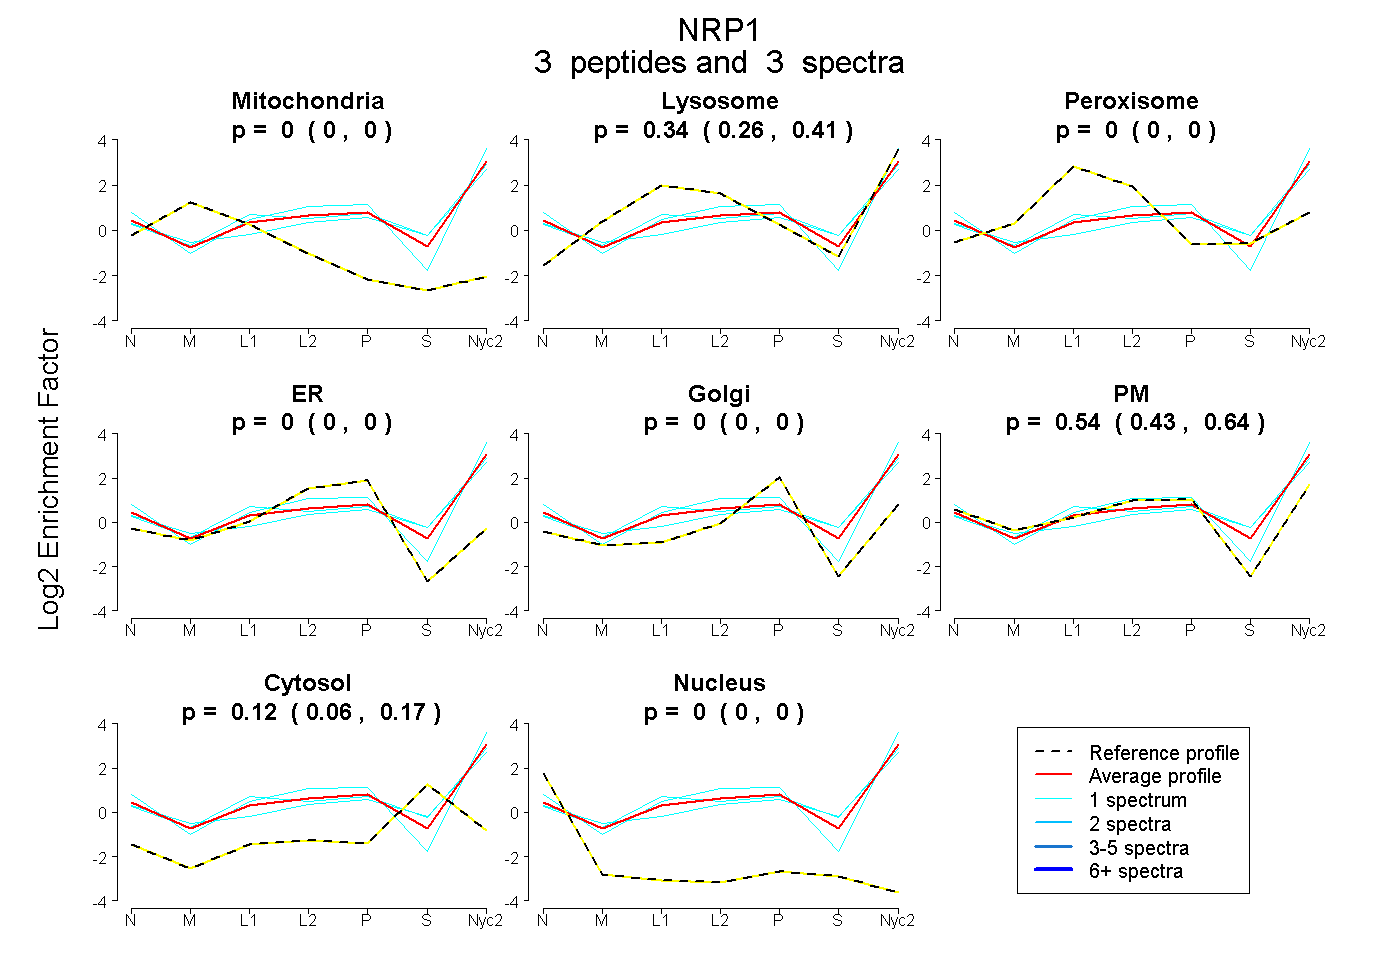
0.000 | 0.000
0.256 | 0.413
0.000 | 0.000
0.000 | 0.000
0.000 | 0.000
0.425 | 0.640
0.062 | 0.166
0.000 | 0.000
| Plot | Mito | Lyso | Perox | ER | Golgi | PM | Cytosol | Nucleus | |||||
| Expt A |
3 peptides |
3 spectra |
|
0.000 0.000 | 0.000 |
0.342 0.256 | 0.413 |
0.000 0.000 | 0.000 |
0.000 0.000 | 0.000 |
0.000 0.000 | 0.000 |
0.539 0.425 | 0.640 |
0.119 0.062 | 0.166 |
0.000 0.000 | 0.000 |
| 1 spectrum, AFTPLSTR | 0.000 | 0.272 | 0.000 | 0.000 | 0.000 | 0.728 | 0.000 | 0.000 | ||
| 1 spectrum, LYQVIFEGEIGK | 0.000 | 0.312 | 0.000 | 0.000 | 0.000 | 0.457 | 0.231 | 0.000 | ||
| 1 spectrum, ATHSGLGLR | 0.000 | 0.442 | 0.000 | 0.000 | 0.000 | 0.381 | 0.177 | 0.000 |
| Plot | Lyso | Other | |||||||||||
| Expt C |
5 peptides |
8 spectra |
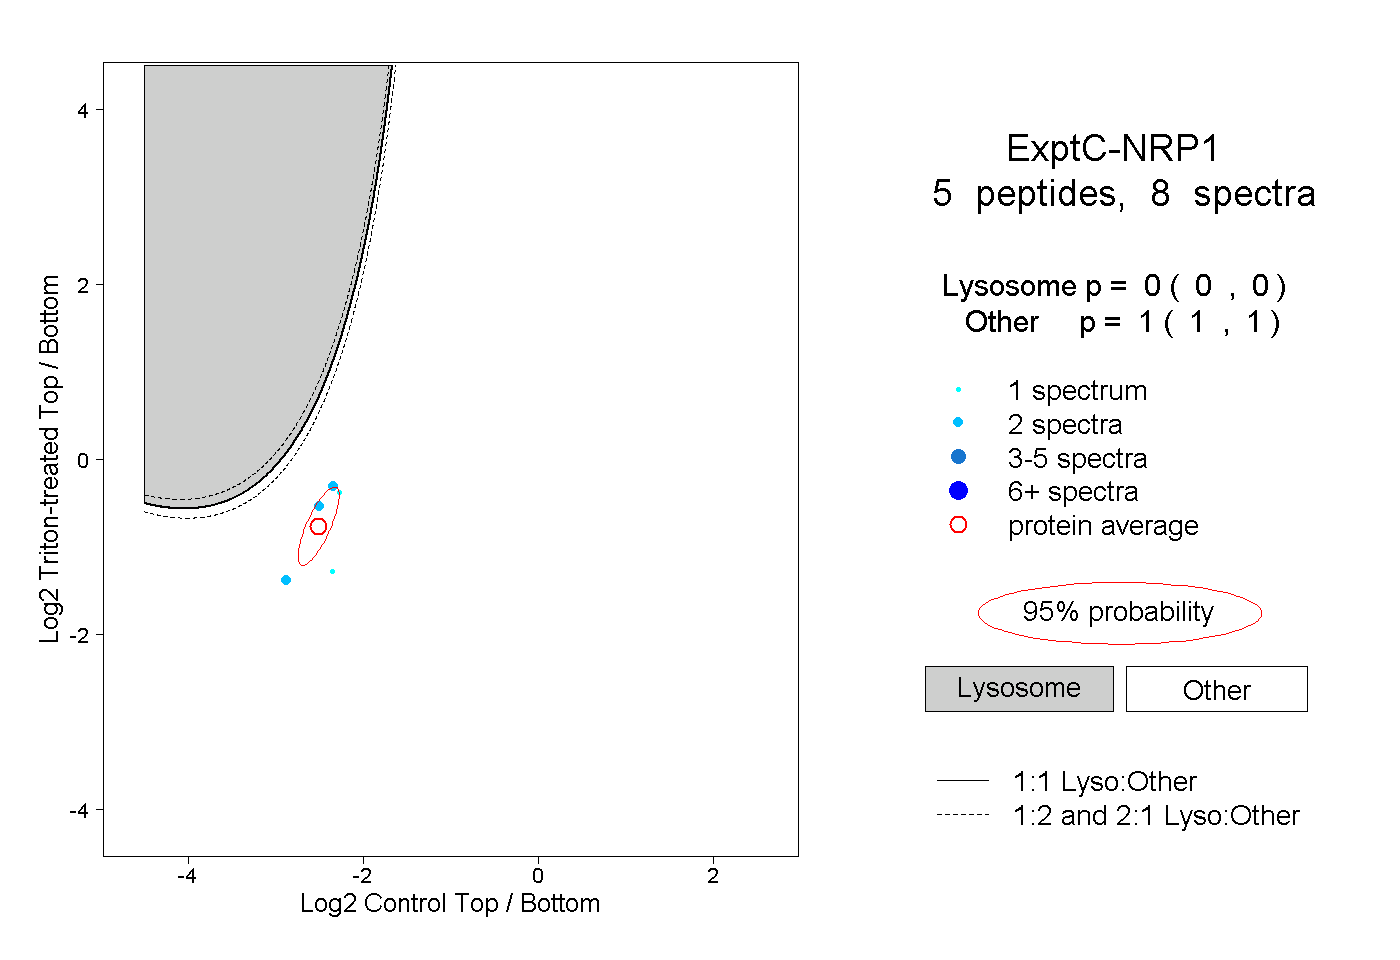 |
0.000 0.000 | 0.000 |
1.000 1.000 | 1.000 |