 5
5peptides
spectra
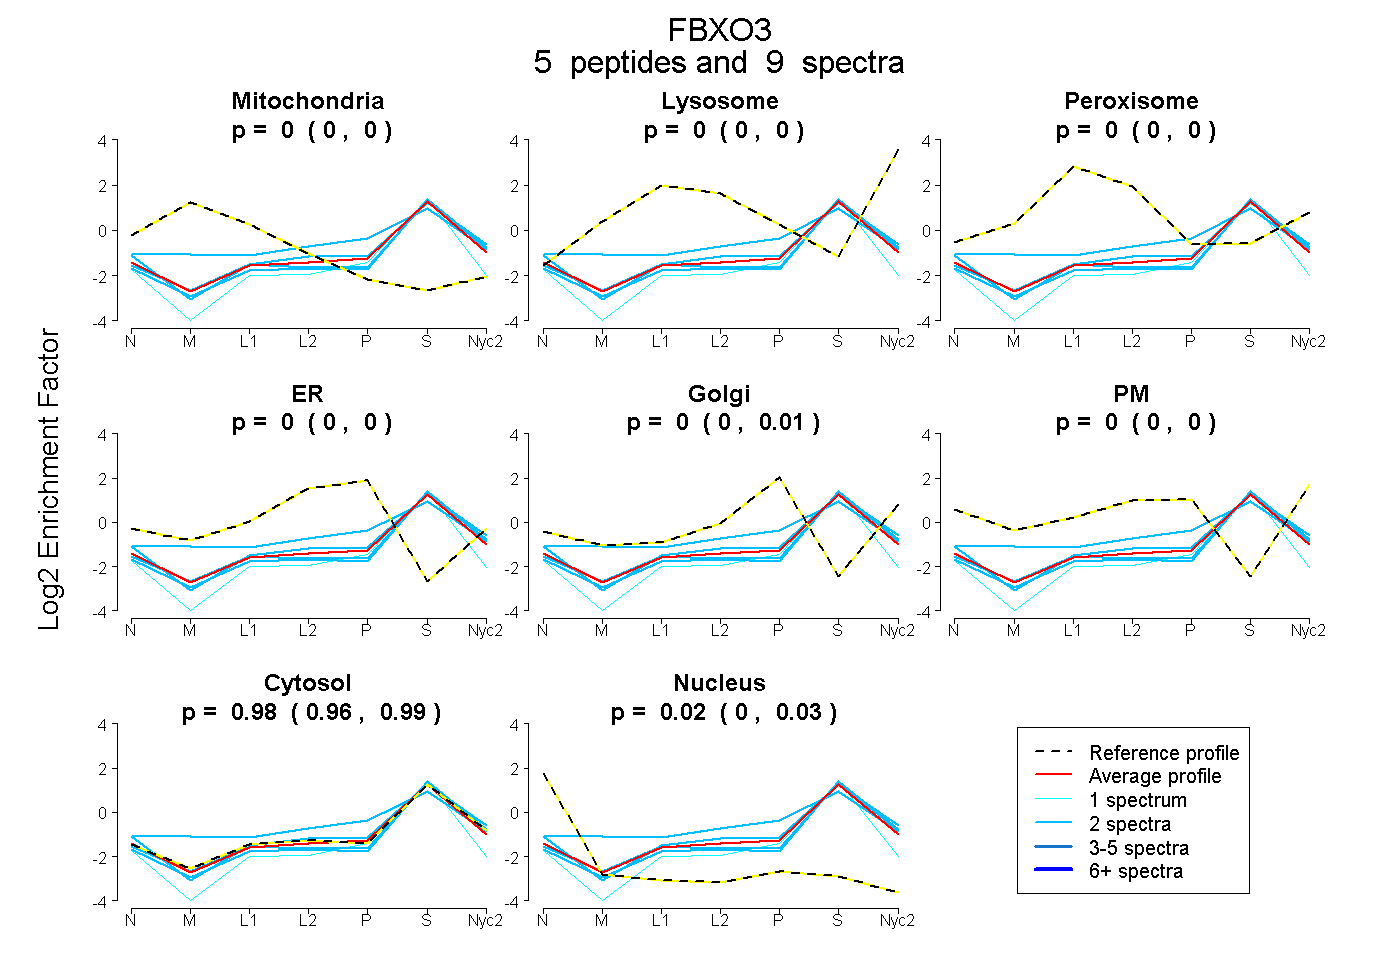
0.000 | 0.000
0.000 | 0.000
0.000 | 0.000
0.000 | 0.000
0.000 | 0.007
0.000 | 0.000
0.964 | 0.993
0.001 | 0.032
| Plot | Mito | Lyso | Perox | ER | Golgi | PM | Cytosol | Nucleus | |||||
| Expt A |
5 peptides |
9 spectra |
|
0.000 0.000 | 0.000 |
0.000 0.000 | 0.000 |
0.000 0.000 | 0.000 |
0.000 0.000 | 0.000 |
0.000 0.000 | 0.007 |
0.000 0.000 | 0.000 |
0.982 0.964 | 0.993 |
0.018 0.001 | 0.032 |
| 2 spectra, FHMACPTFR | 0.056 | 0.000 | 0.076 | 0.074 | 0.083 | 0.000 | 0.711 | 0.000 | ||
| 1 spectrum, DLINCCYVSR | 0.000 | 0.000 | 0.000 | 0.000 | 0.000 | 0.000 | 0.900 | 0.100 | ||
| 2 spectra, SEDLLDVDTAAGGFQQR | 0.000 | 0.000 | 0.000 | 0.000 | 0.027 | 0.000 | 0.973 | 0.000 | ||
| 2 spectra, YWLITEEEK | 0.000 | 0.000 | 0.000 | 0.000 | 0.000 | 0.000 | 0.993 | 0.007 | ||
| 2 spectra, SLFIATYSDVGR | 0.000 | 0.000 | 0.000 | 0.000 | 0.000 | 0.000 | 0.991 | 0.009 |
| Plot | Lyso | Other | |||||||||||
| Expt C |
5 peptides |
14 spectra |
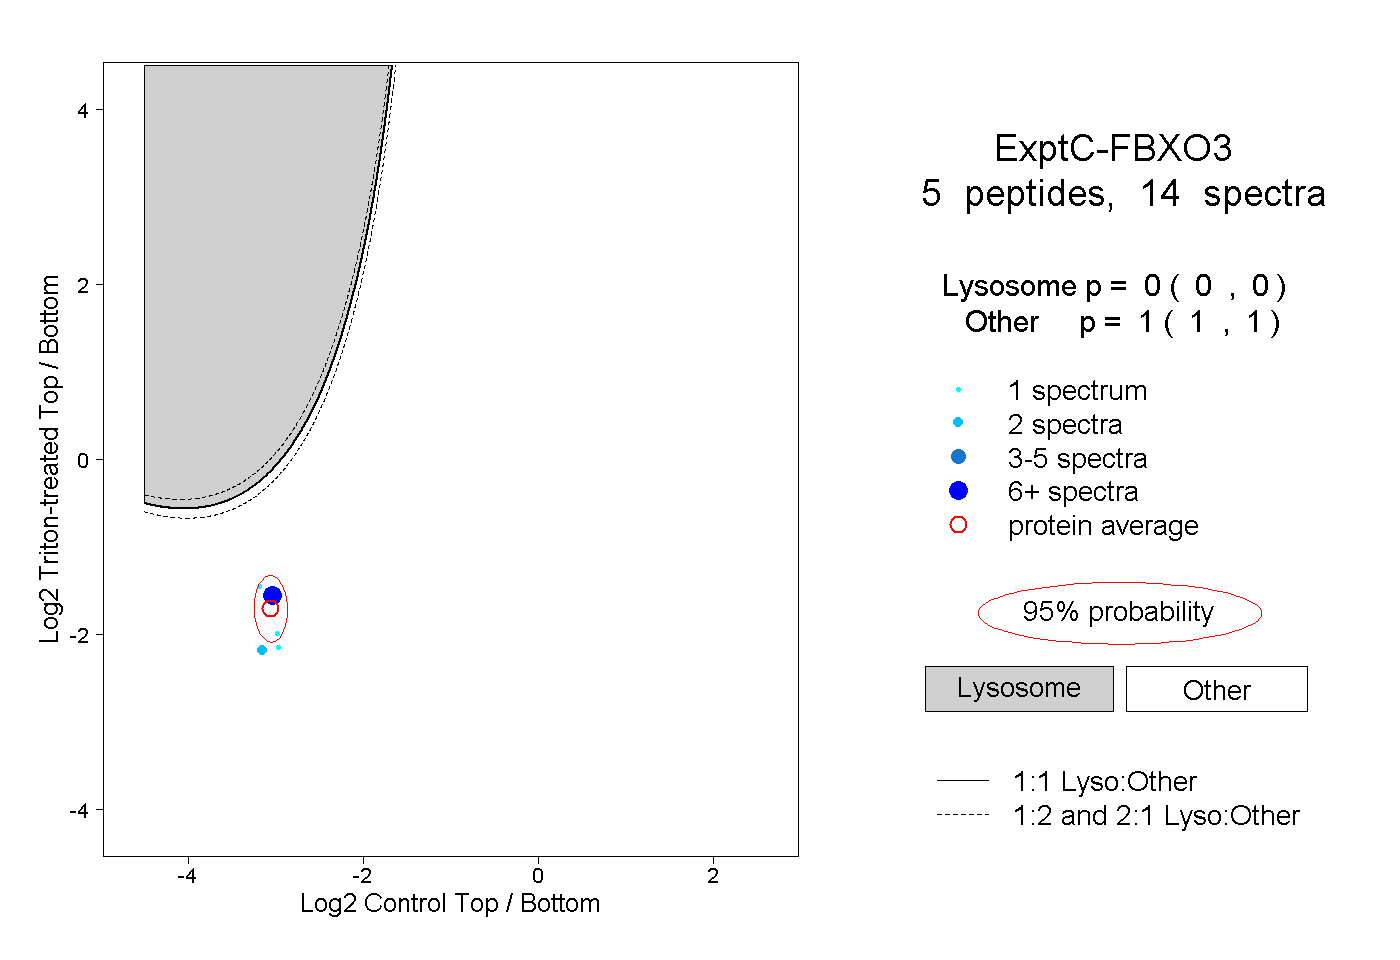 |
0.000 0.000 | 0.000 |
1.000 1.000 | 1.000 |