 1
1peptide
spectra
NA | NA
NA | NA
NA | NA
NA | NA
NA | NA
NA | NA
NA | NA
3peptides
spectra
0.000 | 0.000
1.000 | 1.000
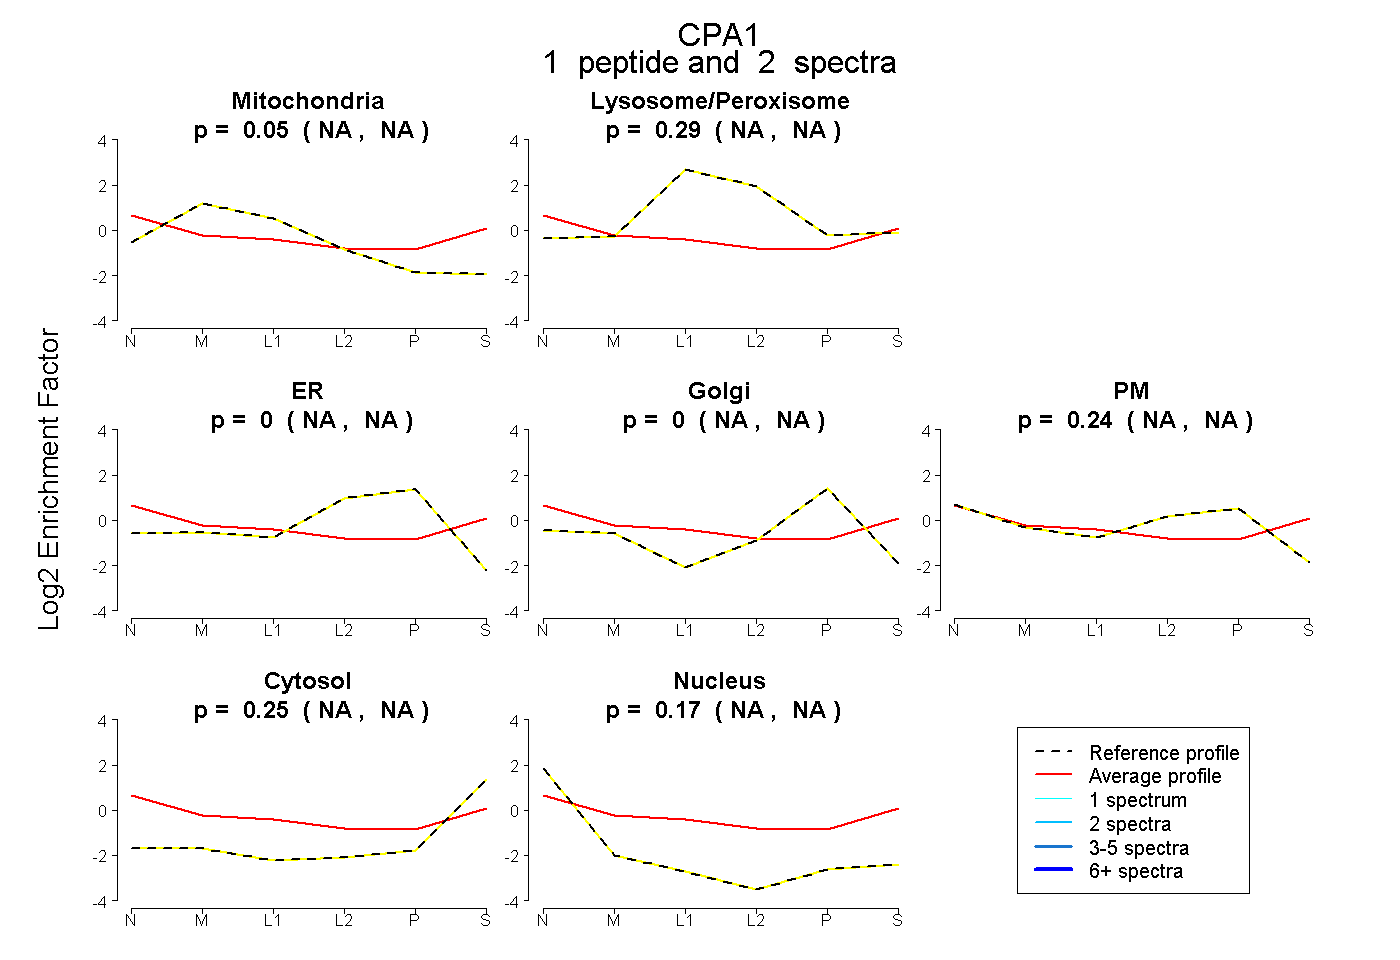
| Plot | Mito | Lyso or Perox | ER | Golgi | PM | Cytosol | Nucleus | ||||||
| Expt B |
1 peptide |
2 spectra |
|
0.054 NA | NA |
0.286 NA | NA |
0.000 NA | NA |
0.000 NA | NA |
0.236 NA | NA |
0.253 NA | NA |
0.172 NA | NA |
|||
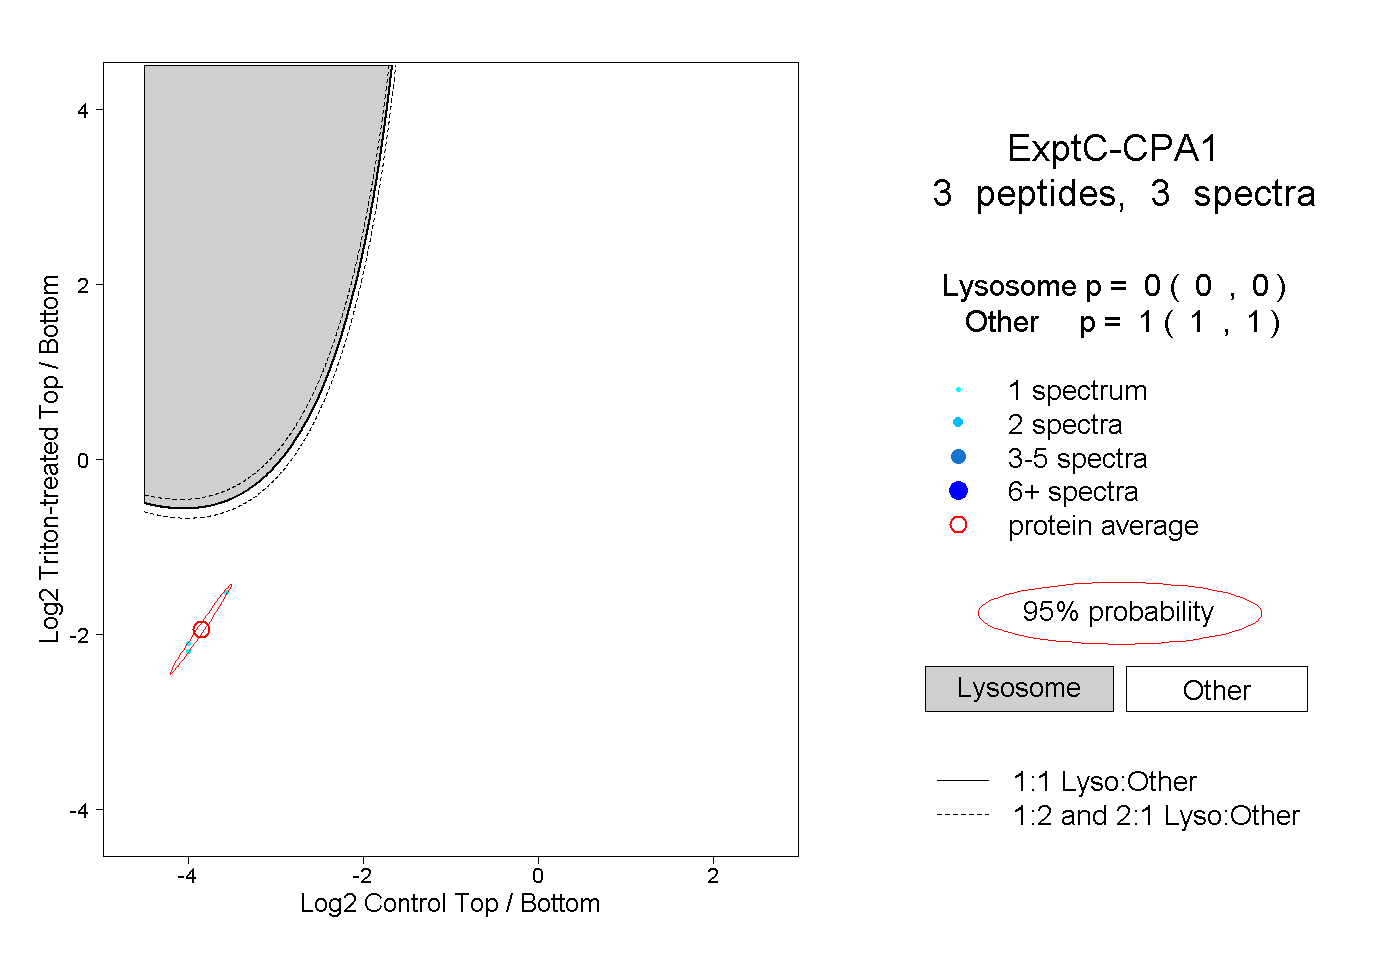
| Plot | Lyso | Other | |||||||||||
| Expt C |
3 peptides |
3 spectra |
|
0.000 0.000 | 0.000 |
1.000 1.000 | 1.000 |