 2
2peptides
spectra
0.000 | 0.000
0.000 | 0.092
0.000 | 0.075
0.000 | 0.104
0.000 | 0.112
0.000 | 0.194
0.767 | 0.805
0.000 | 0.000
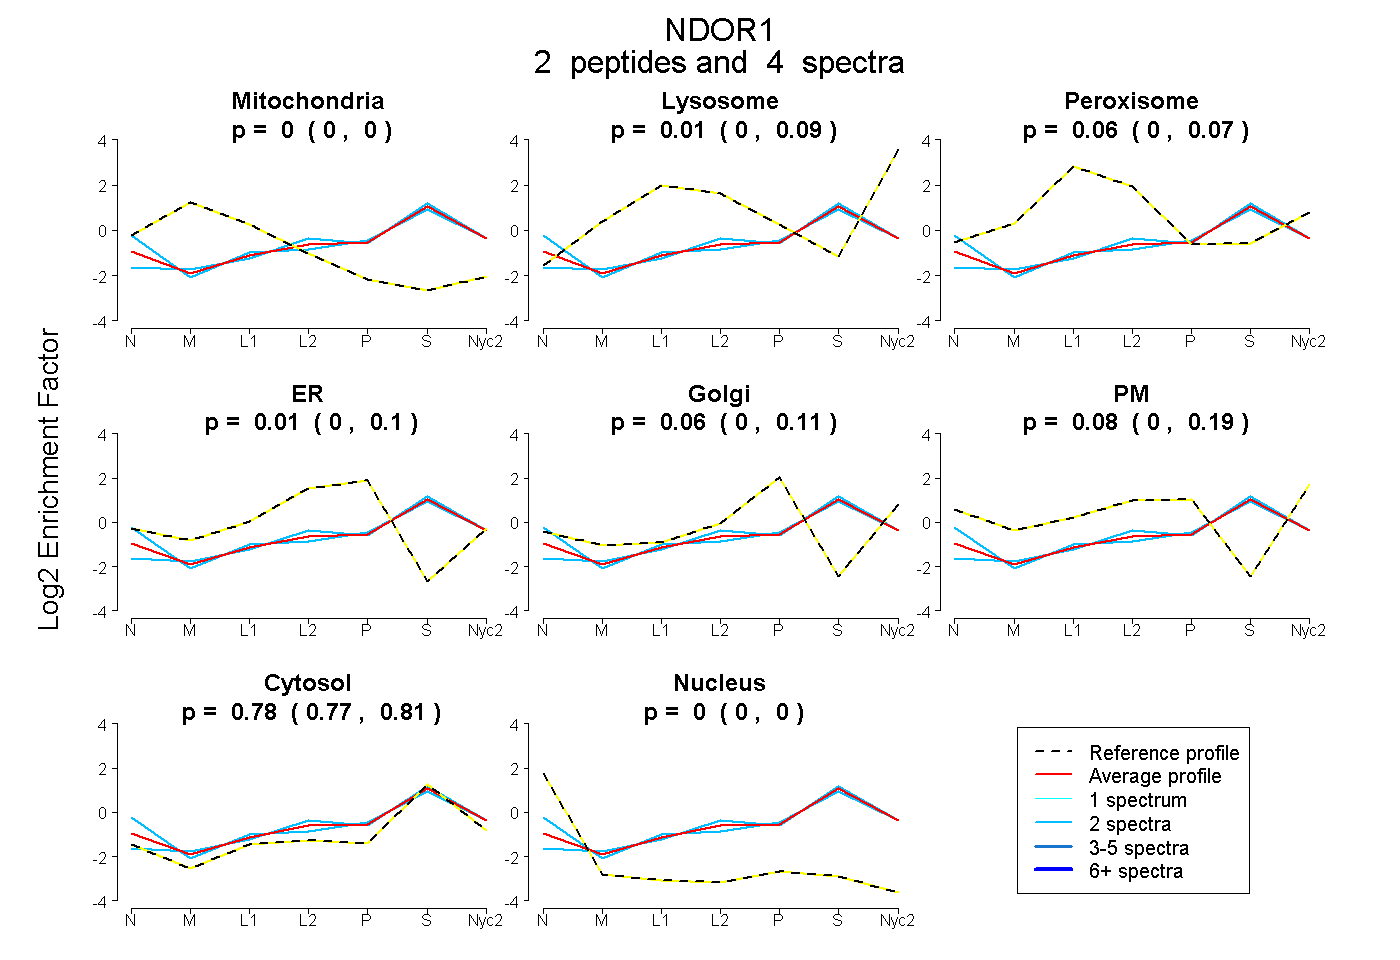
| Plot | Mito | Lyso | Perox | ER | Golgi | PM | Cytosol | Nucleus | |||||
| Expt A |
2 peptides |
4 spectra |
|
0.000 0.000 | 0.000 |
0.008 0.000 | 0.092 |
0.057 0.000 | 0.075 |
0.013 0.000 | 0.104 |
0.060 0.000 | 0.112 |
0.080 0.000 | 0.194 |
0.781 0.767 | 0.805 |
0.000 0.000 | 0.000 |