 6
6peptides
spectra
0.577 | 0.590
0.042 | 0.066
0.000 | 0.025
0.000 | 0.000
0.000 | 0.000
0.338 | 0.356
0.000 | 0.000
0.000 | 0.000
| Plot | Mito | Lyso | Perox | ER | Golgi | PM | Cytosol | Nucleus | |||||
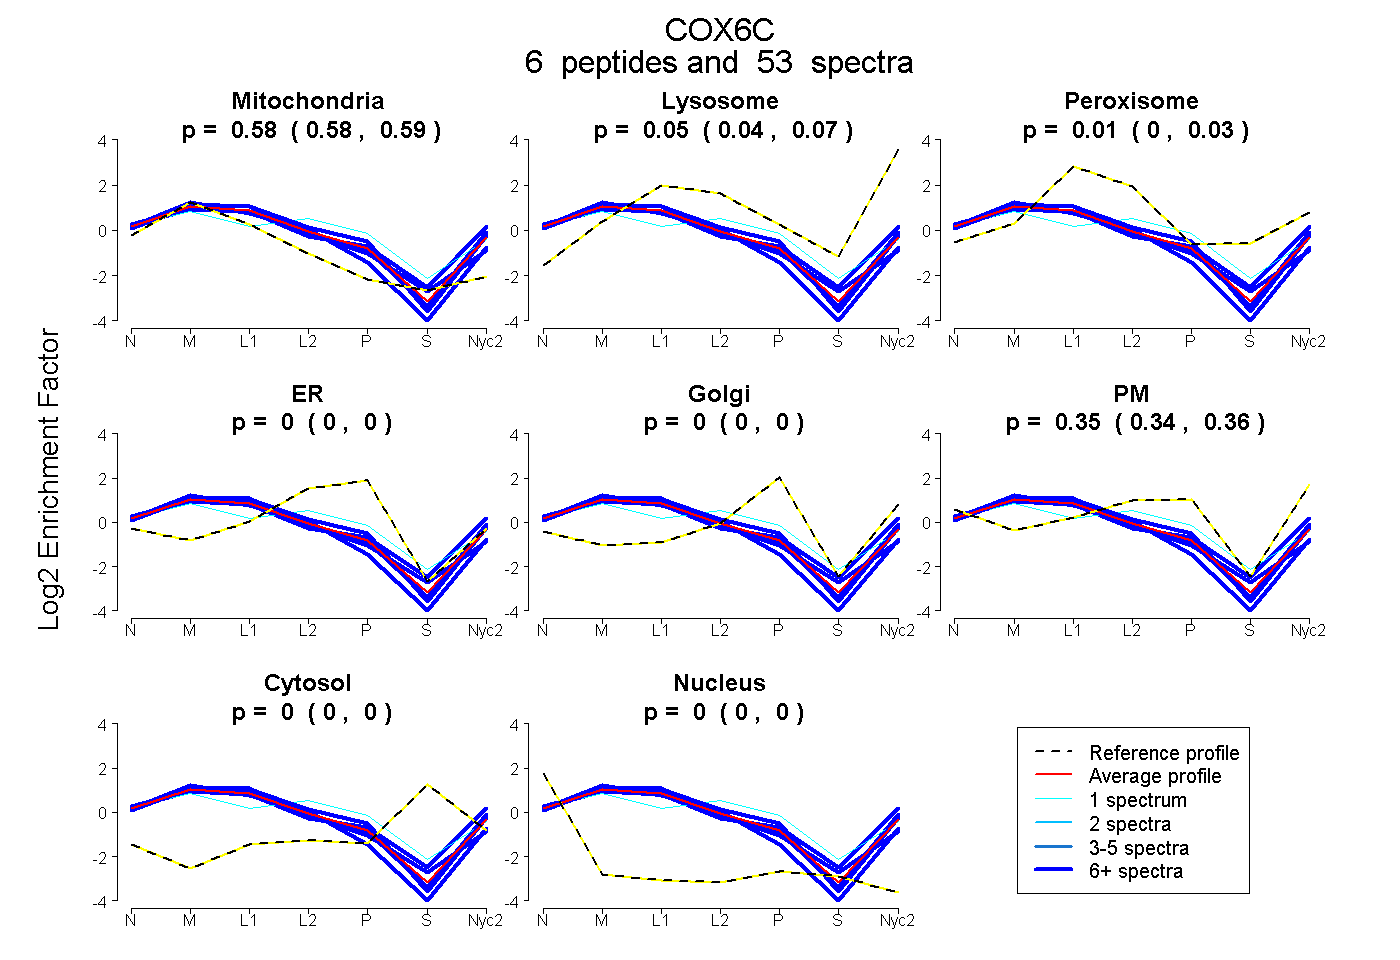
| Expt A |
6 peptides |
53 spectra |
|
0.584 0.577 | 0.590 |
0.055 0.042 | 0.066 |
0.012 0.000 | 0.025 |
0.000 0.000 | 0.000 |
0.000 0.000 | 0.000 |
0.349 0.338 | 0.356 |
0.000 0.000 | 0.000 |
0.000 0.000 | 0.000 |
| 19 spectra, SSGALLPKPQMR | 0.534 | 0.058 | 0.000 | 0.025 | 0.000 | 0.382 | 0.000 | 0.000 | ||
| 8 spectra, FGVAEPR | 0.526 | 0.137 | 0.000 | 0.000 | 0.000 | 0.337 | 0.000 | 0.000 | ||
| 7 spectra, AYADFYR | 0.636 | 0.000 | 0.104 | 0.000 | 0.000 | 0.260 | 0.000 | 0.000 | ||
| 1 spectrum, NYDSMK | 0.425 | 0.000 | 0.087 | 0.185 | 0.000 | 0.303 | 0.000 | 0.000 | ||
| 12 spectra, DFEEMR | 0.581 | 0.115 | 0.000 | 0.000 | 0.000 | 0.304 | 0.000 | 0.000 | ||
| 6 spectra, QAGVFQSAK | 0.701 | 0.000 | 0.000 | 0.000 | 0.000 | 0.299 | 0.000 | 0.000 |
| Plot | Mito | Lyso or Perox | ER | Golgi | PM | Cytosol | Nucleus | ||||||
| Expt B |
5 peptides |
20 spectra |
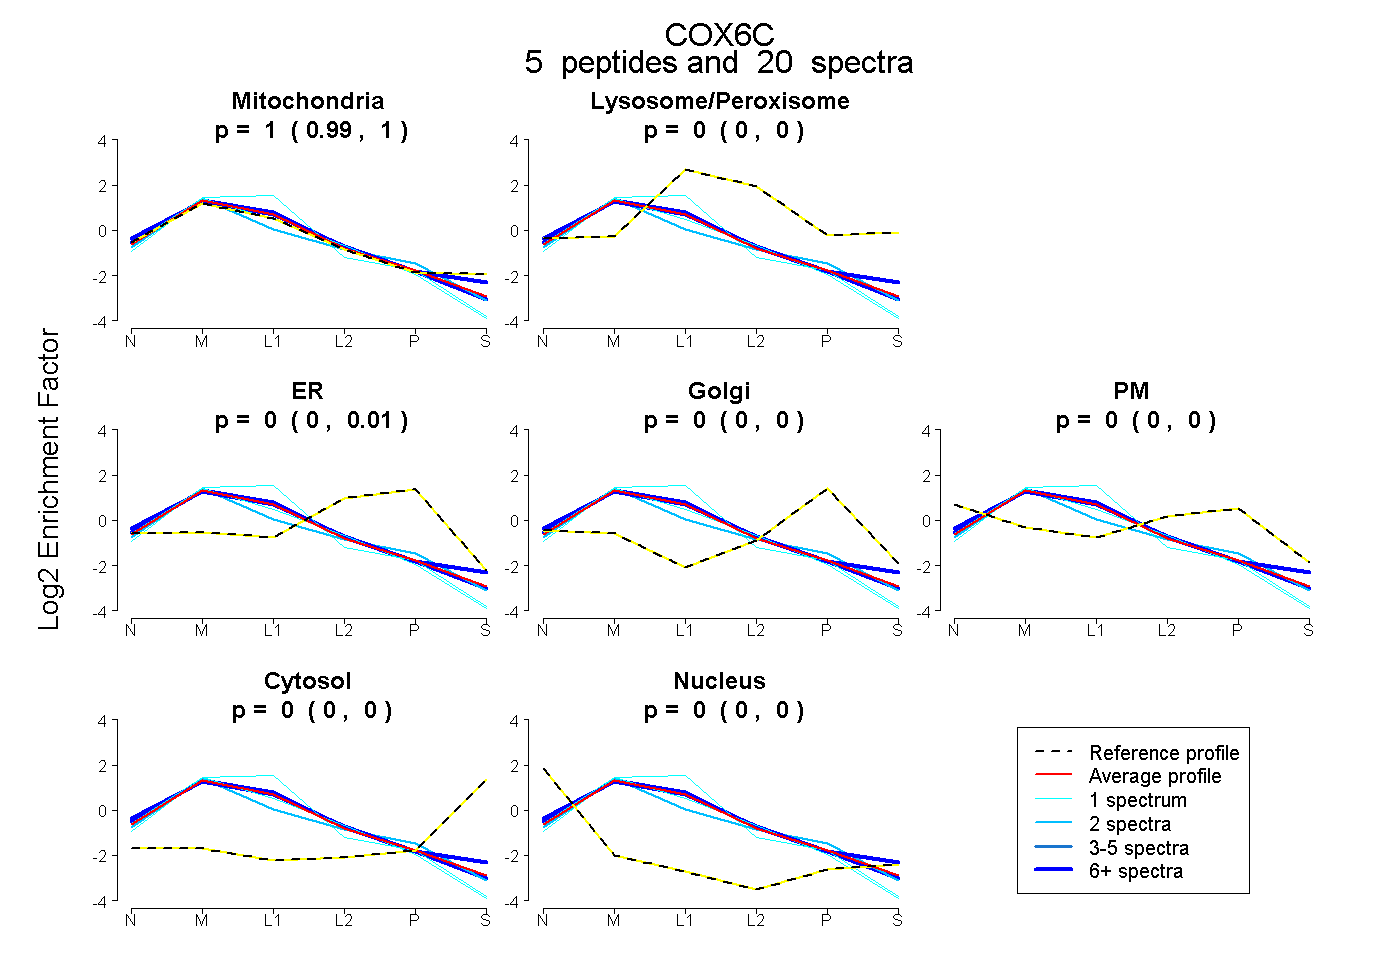 |
0.995 0.985 | 1.000 |
0.000 0.000 | 0.000 |
0.005 0.000 | 0.013 |
0.000 0.000 | 0.000 |
0.000 0.000 | 0.000 |
0.000 0.000 | 0.000 |
0.000 0.000 | 0.000 |
|||
| Plot | Lyso | Other | |||||||||||
| Expt C |
7 peptides |
214 spectra |
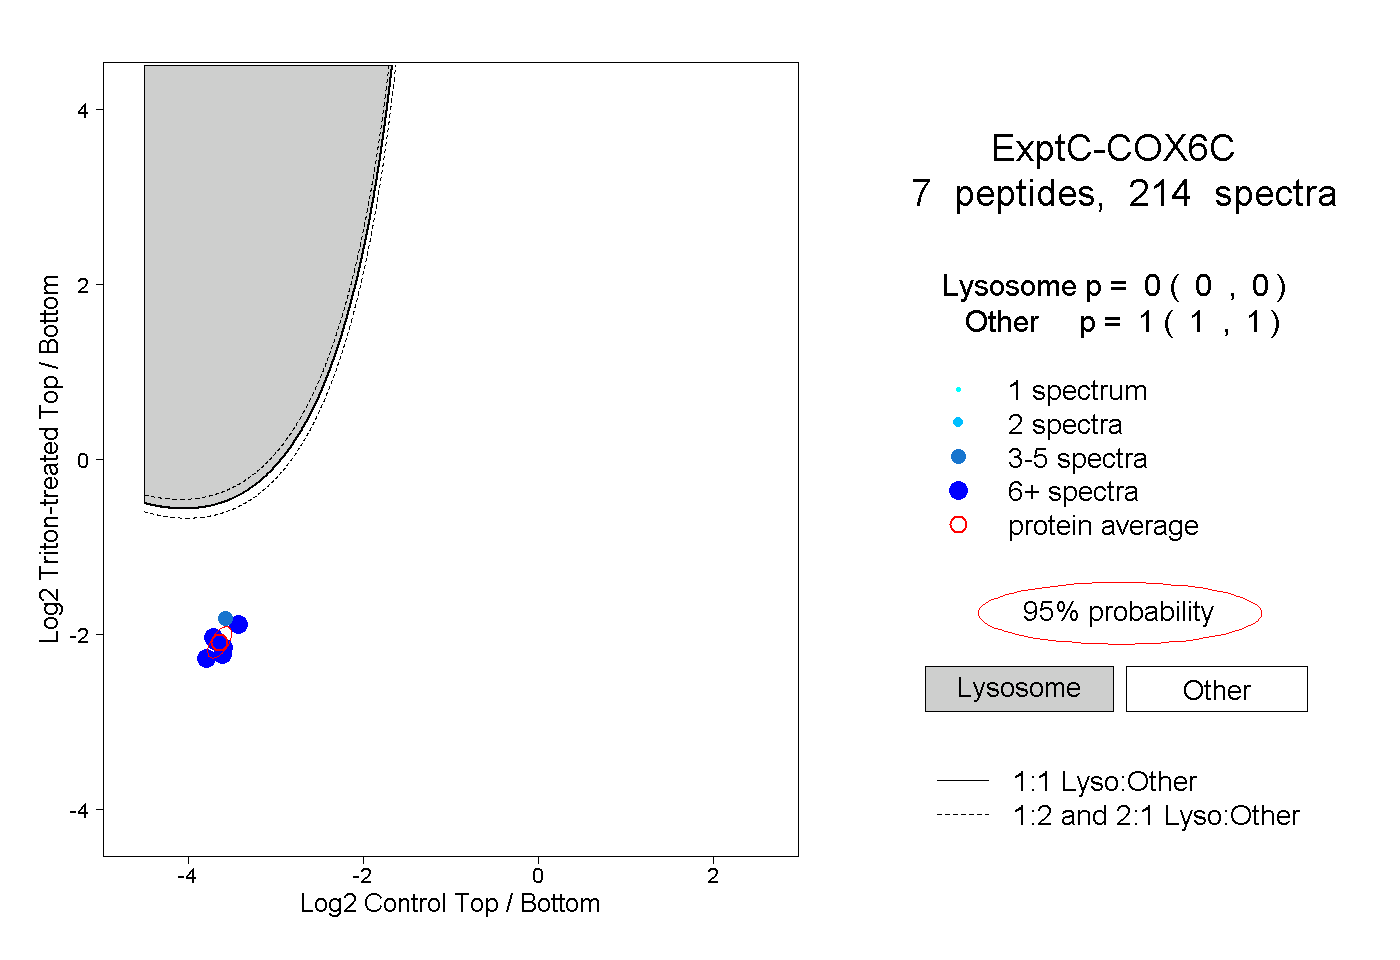 |
0.000 0.000 | 0.000 |
1.000 1.000 | 1.000 |
||||||||
| Plot | Lyso | Other | |||||||||||
| Expt D |
4 peptides |
16 spectra |
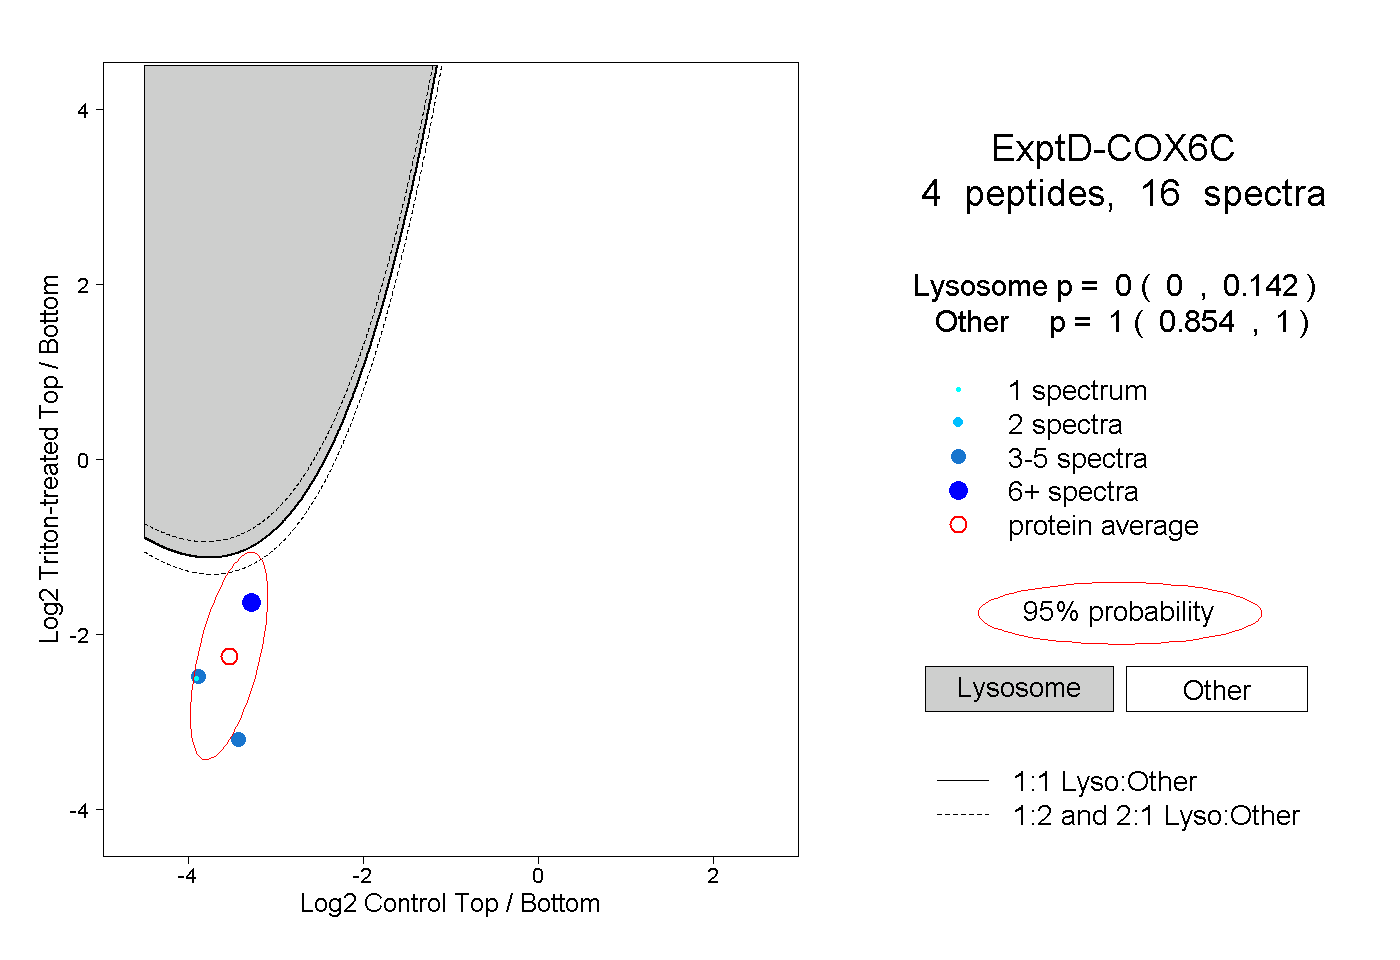 |
0.000 0.000 | 0.142 |
1.000 0.854 | 1.000 |