 8
8peptides
spectra
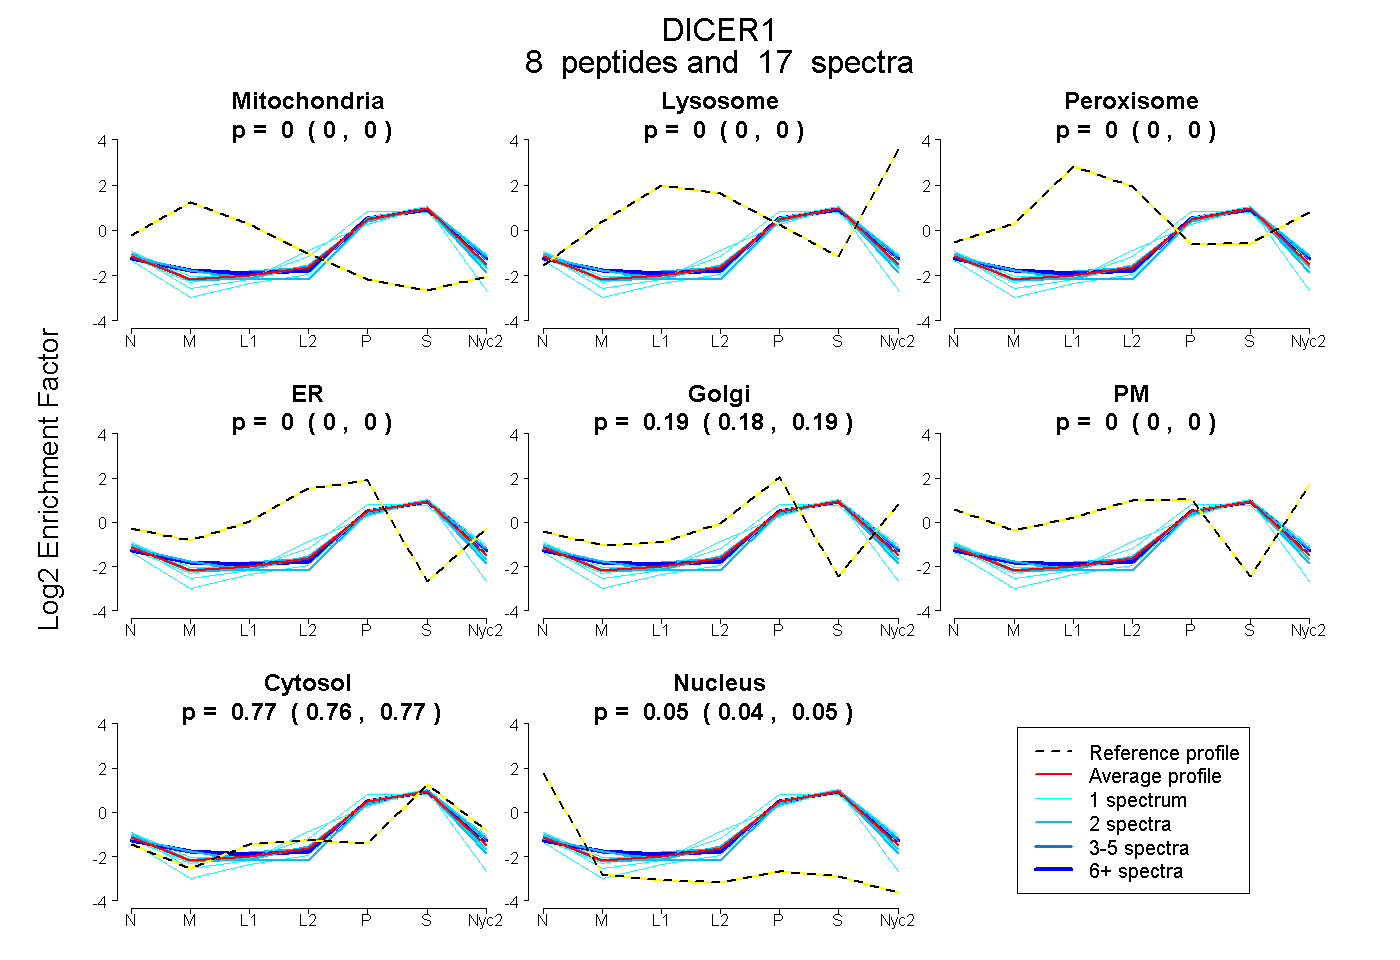
0.000 | 0.000
0.000 | 0.000
0.000 | 0.000
0.000 | 0.000
0.182 | 0.194
0.000 | 0.000
0.761 | 0.769
0.040 | 0.052
| Plot | Mito | Lyso | Perox | ER | Golgi | PM | Cytosol | Nucleus | |||||
| Expt A |
8 peptides |
17 spectra |
|
0.000 0.000 | 0.000 |
0.000 0.000 | 0.000 |
0.000 0.000 | 0.000 |
0.000 0.000 | 0.000 |
0.188 0.182 | 0.194 |
0.000 0.000 | 0.000 |
0.765 0.761 | 0.769 |
0.046 0.040 | 0.052 |
| 1 spectrum, LEMLGDSFLK | 0.000 | 0.000 | 0.000 | 0.000 | 0.133 | 0.000 | 0.816 | 0.051 | ||
| 1 spectrum, HEQEELHR | 0.000 | 0.000 | 0.000 | 0.000 | 0.199 | 0.000 | 0.799 | 0.002 | ||
| 2 spectra, SFEEDLK | 0.000 | 0.000 | 0.000 | 0.000 | 0.151 | 0.000 | 0.747 | 0.102 | ||
| 1 spectrum, AVCLPSILYR | 0.000 | 0.000 | 0.000 | 0.104 | 0.000 | 0.000 | 0.769 | 0.127 | ||
| 2 spectra, AQTASDAGVGVR | 0.000 | 0.000 | 0.000 | 0.000 | 0.171 | 0.000 | 0.765 | 0.064 | ||
| 1 spectrum, CDPDELEEK | 0.000 | 0.000 | 0.000 | 0.008 | 0.253 | 0.000 | 0.685 | 0.053 | ||
| 2 spectra, LNLLTPR | 0.000 | 0.000 | 0.000 | 0.000 | 0.207 | 0.000 | 0.765 | 0.028 | ||
| 7 spectra, FMEDIEK | 0.000 | 0.000 | 0.000 | 0.000 | 0.221 | 0.000 | 0.759 | 0.020 |
| Plot | Lyso | Other | |||||||||||
| Expt C |
1 peptide |
3 spectra |
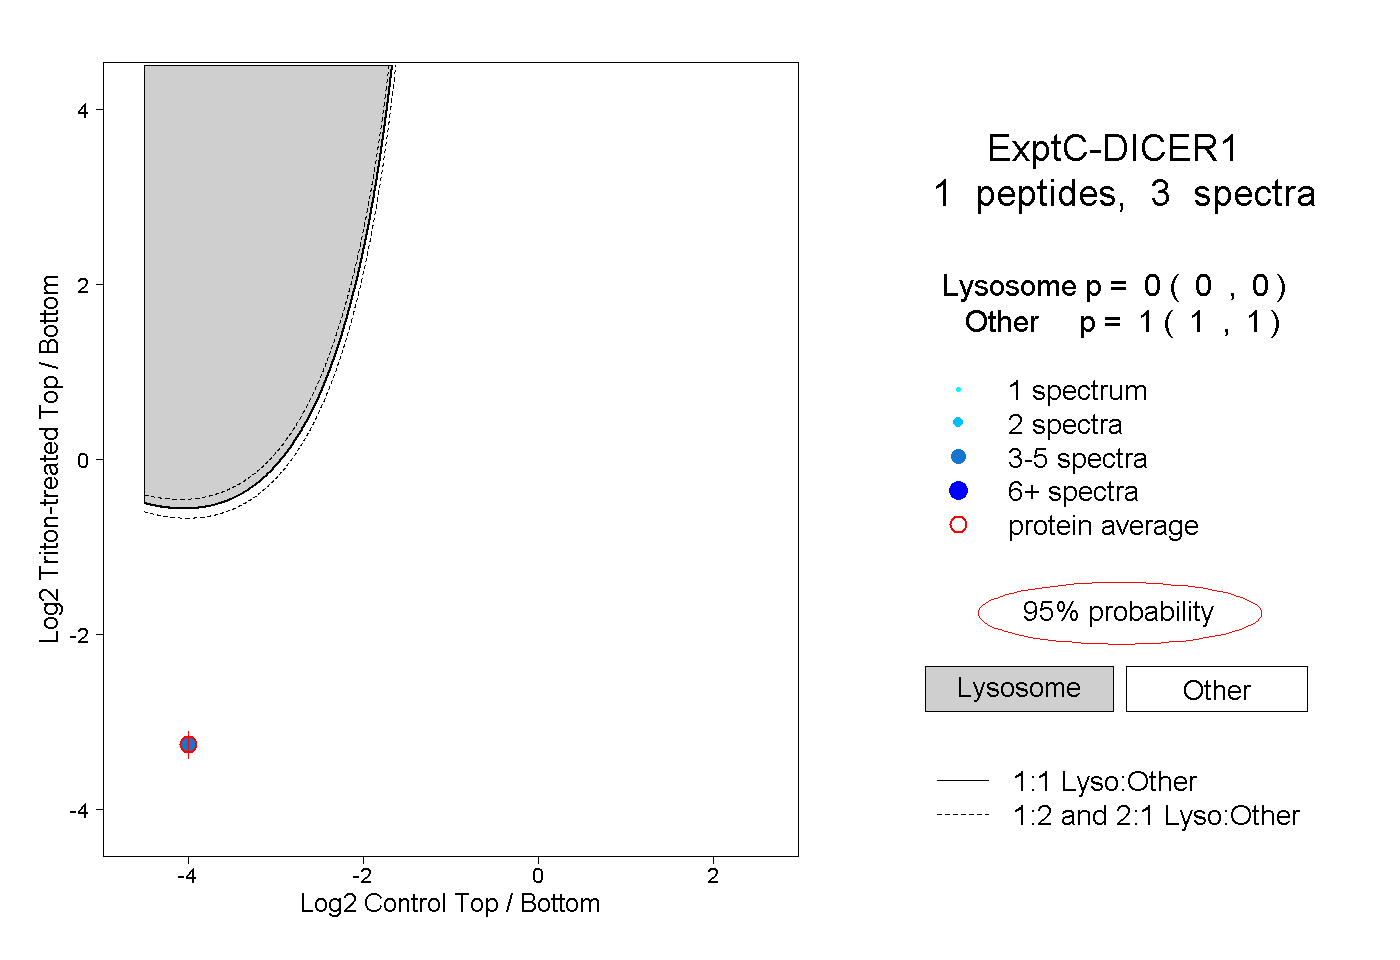 |
0.000 0.000 | 0.000 |
1.000 1.000 | 1.000 |