 8
8peptides
spectra
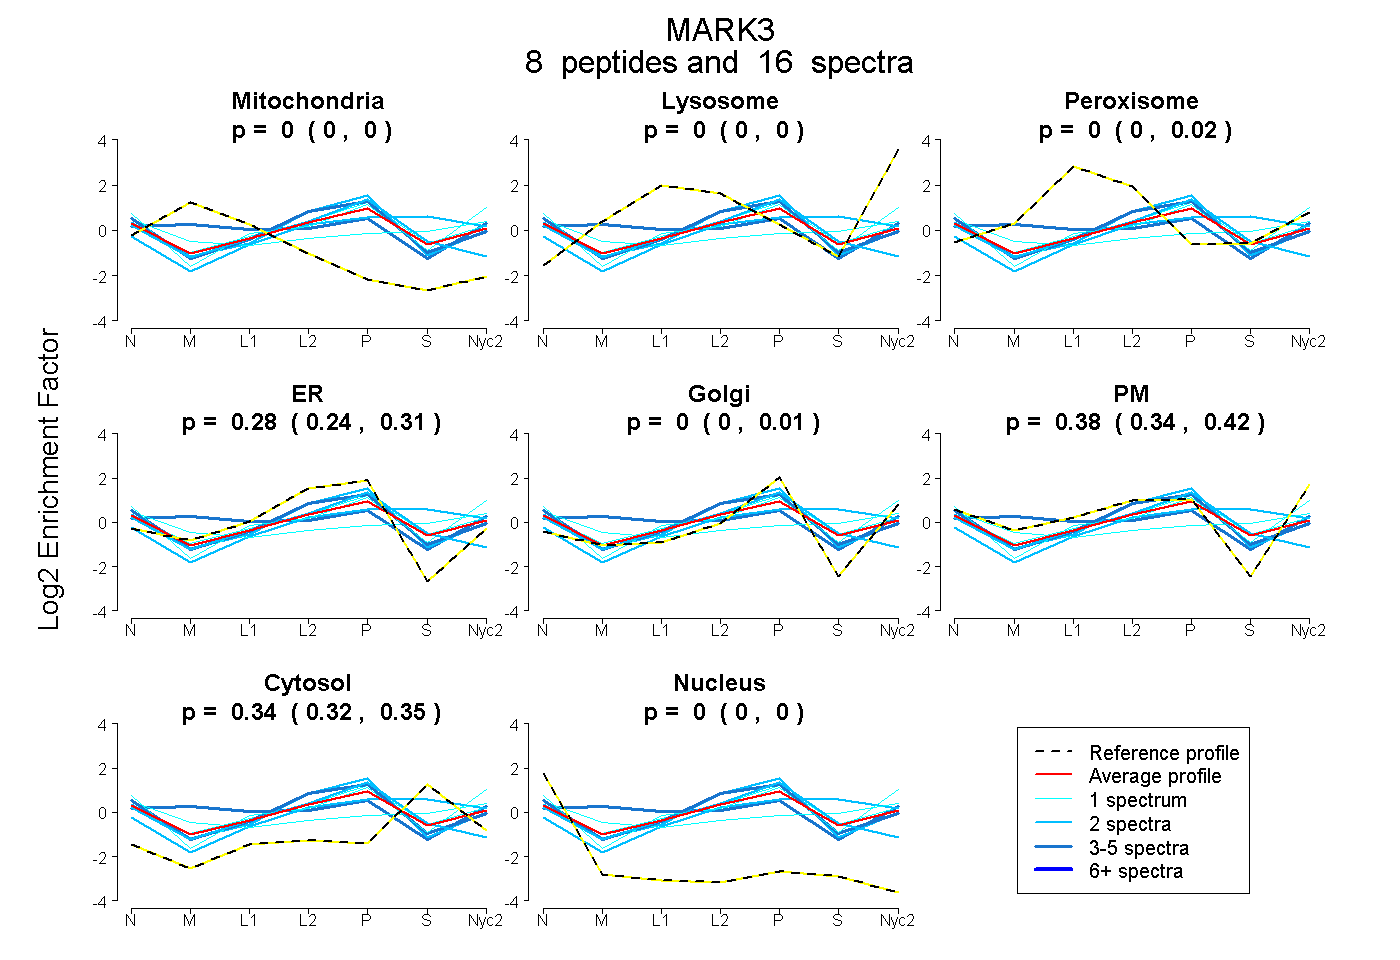
0.000 | 0.000
0.000 | 0.000
0.000 | 0.016
0.238 | 0.314
0.000 | 0.006
0.339 | 0.415
0.322 | 0.349
0.000 | 0.000
| Plot | Mito | Lyso | Perox | ER | Golgi | PM | Cytosol | Nucleus | |||||
| Expt A |
8 peptides |
16 spectra |
|
0.000 0.000 | 0.000 |
0.000 0.000 | 0.000 |
0.001 0.000 | 0.016 |
0.279 0.238 | 0.314 |
0.000 0.000 | 0.006 |
0.382 0.339 | 0.415 |
0.338 0.322 | 0.349 |
0.000 0.000 | 0.000 |
| 1 spectrum, FTWSMK | 0.000 | 0.000 | 0.031 | 0.254 | 0.078 | 0.340 | 0.297 | 0.000 | ||
| 1 spectrum, ILNHPNIVK | 0.078 | 0.000 | 0.007 | 0.000 | 0.000 | 0.484 | 0.431 | 0.000 | ||
| 4 spectra, LFEVIETEK | 0.000 | 0.000 | 0.000 | 0.466 | 0.000 | 0.279 | 0.255 | 0.000 | ||
| 2 spectra, GTLEQIMK | 0.000 | 0.025 | 0.026 | 0.161 | 0.000 | 0.241 | 0.547 | 0.000 | ||
| 1 spectrum, QEVTSR | 0.000 | 0.000 | 0.000 | 0.000 | 0.122 | 0.614 | 0.264 | 0.000 | ||
| 3 spectra, AENLLLDADMNIK | 0.189 | 0.000 | 0.158 | 0.000 | 0.250 | 0.301 | 0.102 | 0.000 | ||
| 2 spectra, QIVSAVQYCHQK | 0.000 | 0.000 | 0.000 | 0.637 | 0.000 | 0.000 | 0.341 | 0.021 | ||
| 2 spectra, HILTGR | 0.000 | 0.000 | 0.000 | 0.490 | 0.090 | 0.202 | 0.219 | 0.000 |
| Plot | Lyso | Other | |||||||||||
| Expt C |
8 peptides |
10 spectra |
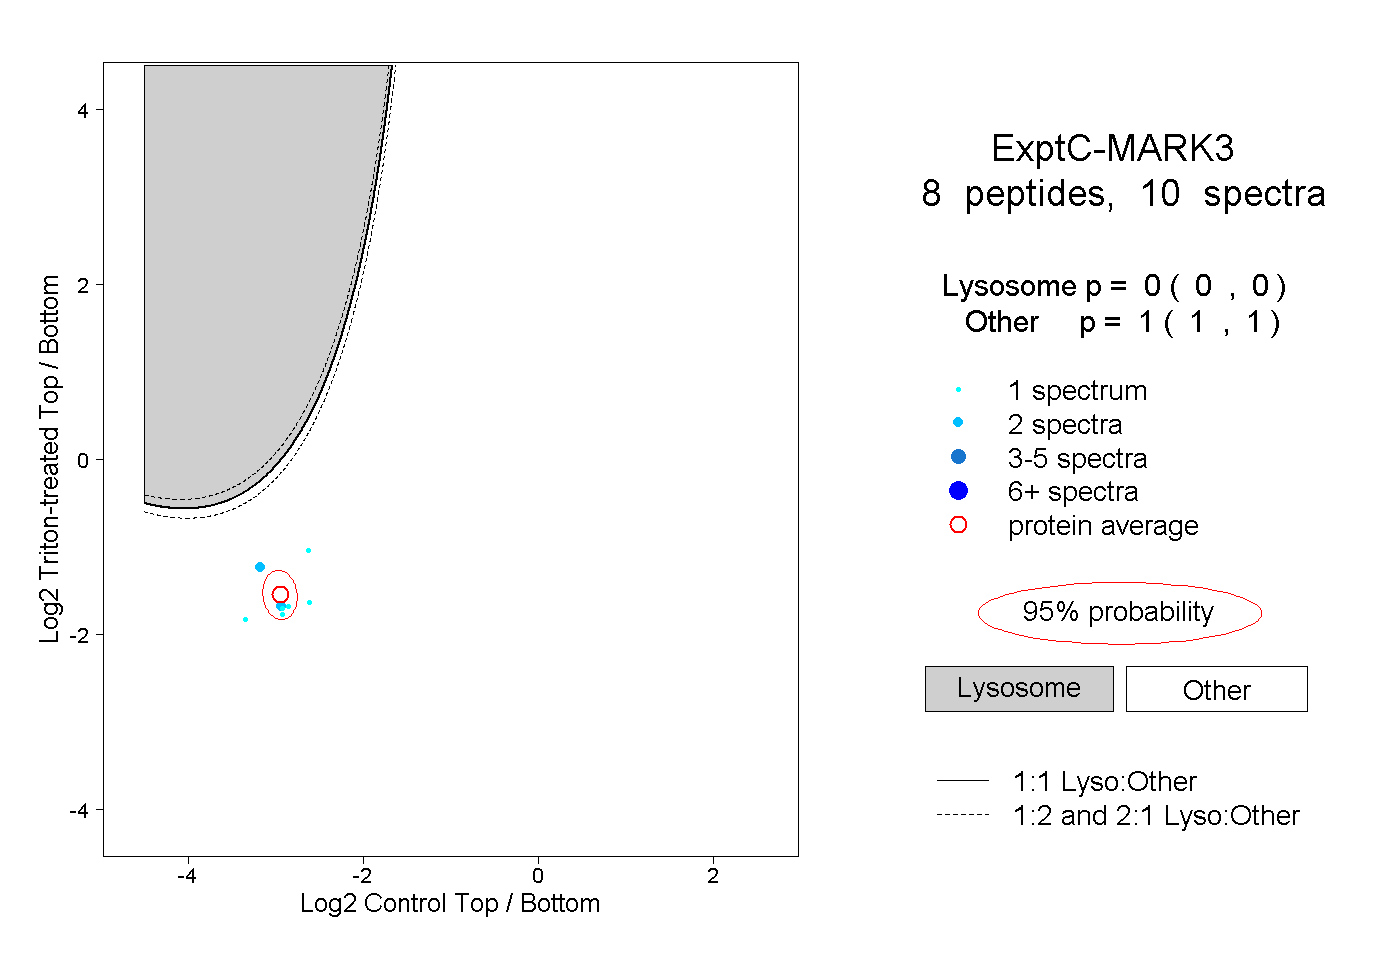 |
0.000 0.000 | 0.000 |
1.000 1.000 | 1.000 |
||||||||
| Plot | Lyso | Other | |||||||||||
| Expt D |
2 peptides |
2 spectra |
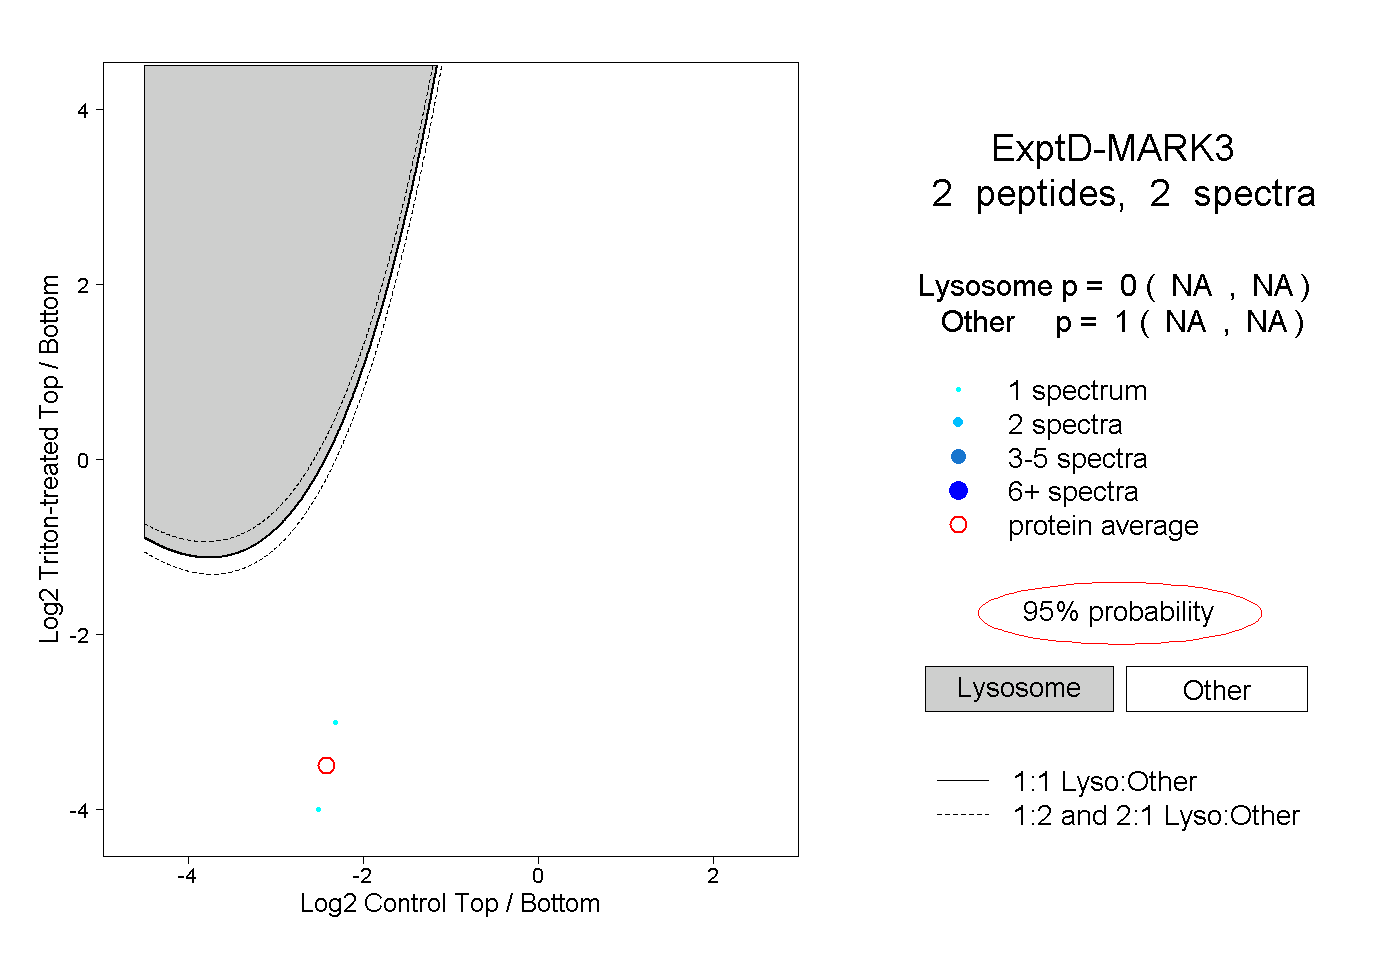 |
0.000 NA | NA |
1.000 NA | NA |