 3
3peptides
spectra
0.000 | 0.000
0.109 | 0.235
0.000 | 0.107
0.000 | 0.153
0.000 | 0.153
0.344 | 0.493
0.198 | 0.254
0.000 | 0.000
| Plot | Mito | Lyso | Perox | ER | Golgi | PM | Cytosol | Nucleus | |||||
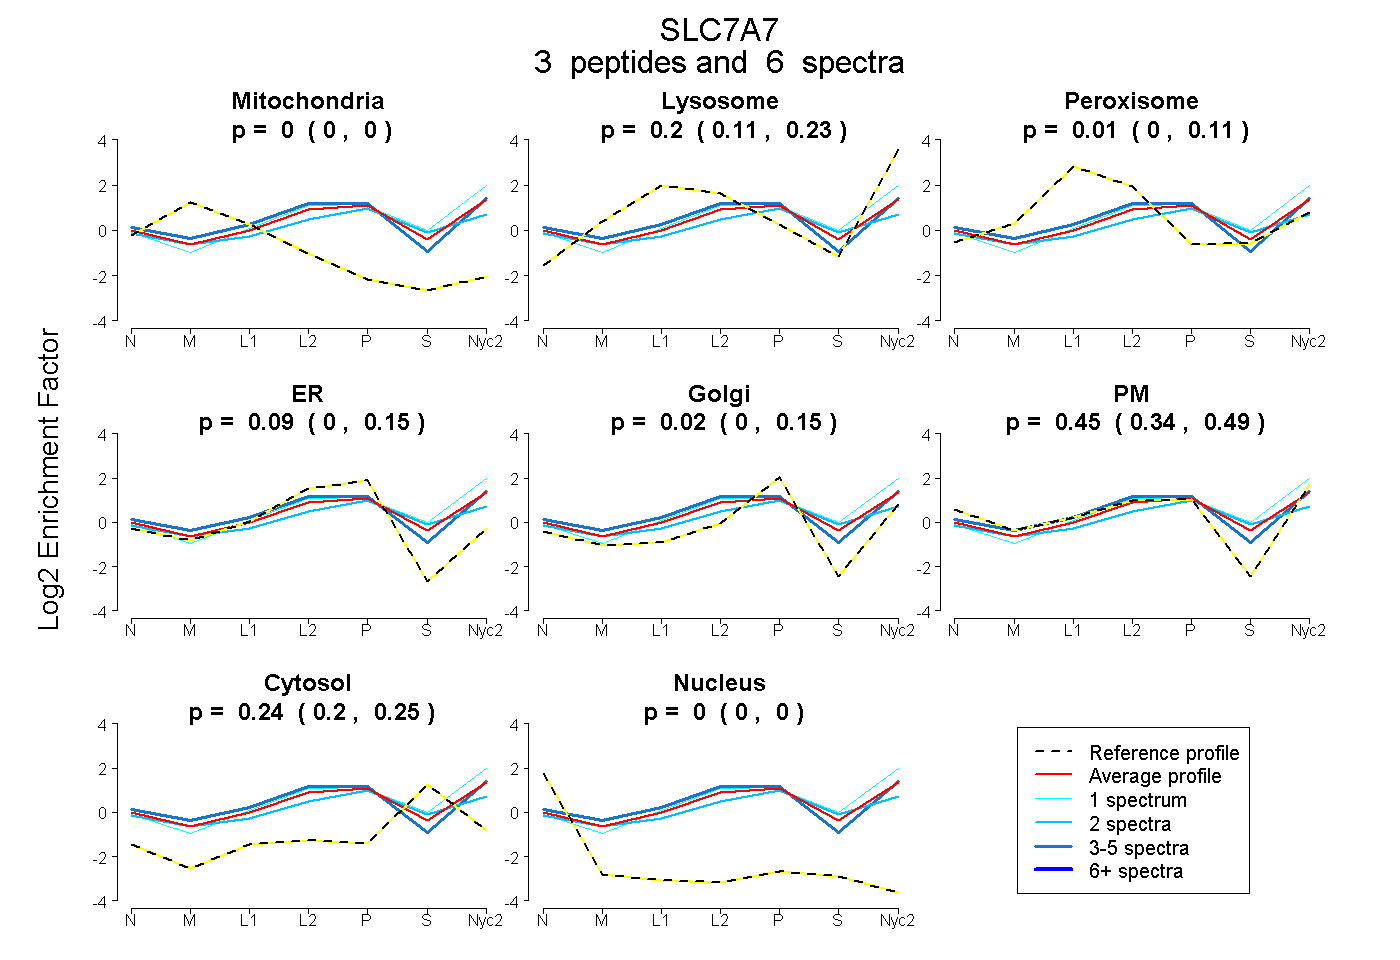
| Expt A |
3 peptides |
6 spectra |
|
0.000 0.000 | 0.000 |
0.197 0.109 | 0.235 |
0.014 0.000 | 0.107 |
0.088 0.000 | 0.153 |
0.018 0.000 | 0.153 |
0.446 0.344 | 0.493 |
0.238 0.198 | 0.254 |
0.000 0.000 | 0.000 |
| 1 spectrum, IVASTTR | 0.000 | 0.308 | 0.000 | 0.000 | 0.002 | 0.435 | 0.255 | 0.000 | ||
| 2 spectra, VASTK | 0.000 | 0.037 | 0.176 | 0.000 | 0.281 | 0.227 | 0.279 | 0.000 | ||
| 3 spectra, RPLCLR | 0.000 | 0.154 | 0.062 | 0.139 | 0.000 | 0.516 | 0.129 | 0.000 |
| Plot | Lyso | Other | |||||||||||
| Expt C |
2 peptides |
9 spectra |
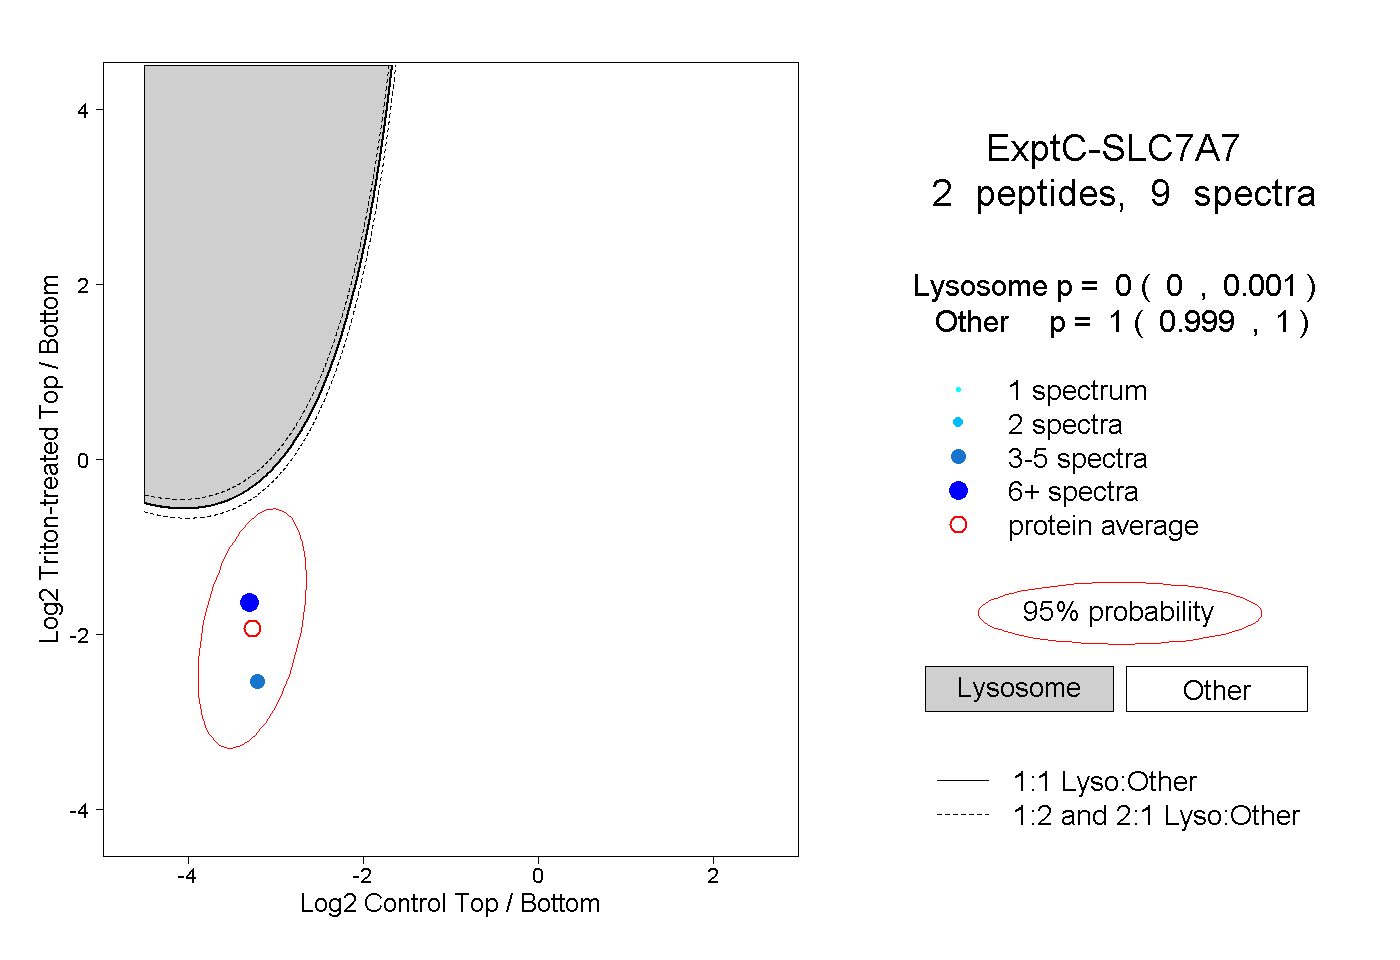 |
0.000 0.000 | 0.001 |
1.000 0.999 | 1.000 |
||||||||
| Plot | Lyso | Other | |||||||||||
| Expt D |
1 peptide |
1 spectrum |
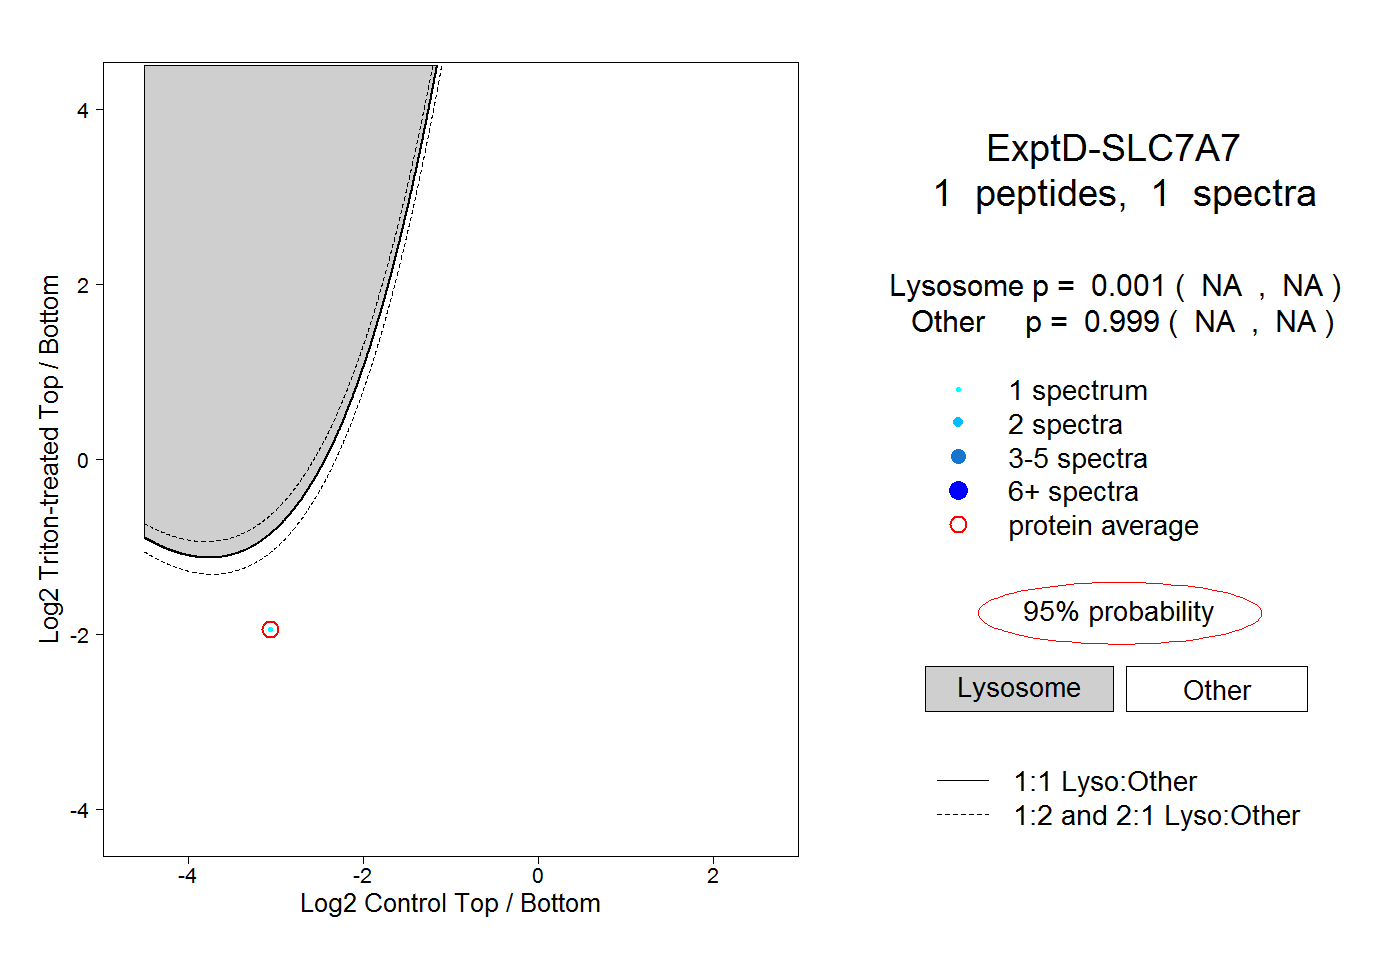 |
0.001 NA | NA |
0.999 NA | NA |