 4
4peptides
spectra
0.081 | 0.449
0.000 | 0.233
0.000 | 0.376
0.000 | 0.000
0.000 | 0.000
0.129 | 0.448
0.000 | 0.055
0.000 | 0.172
3peptides
spectra
0.000 | 0.259
0.709 | 1.000
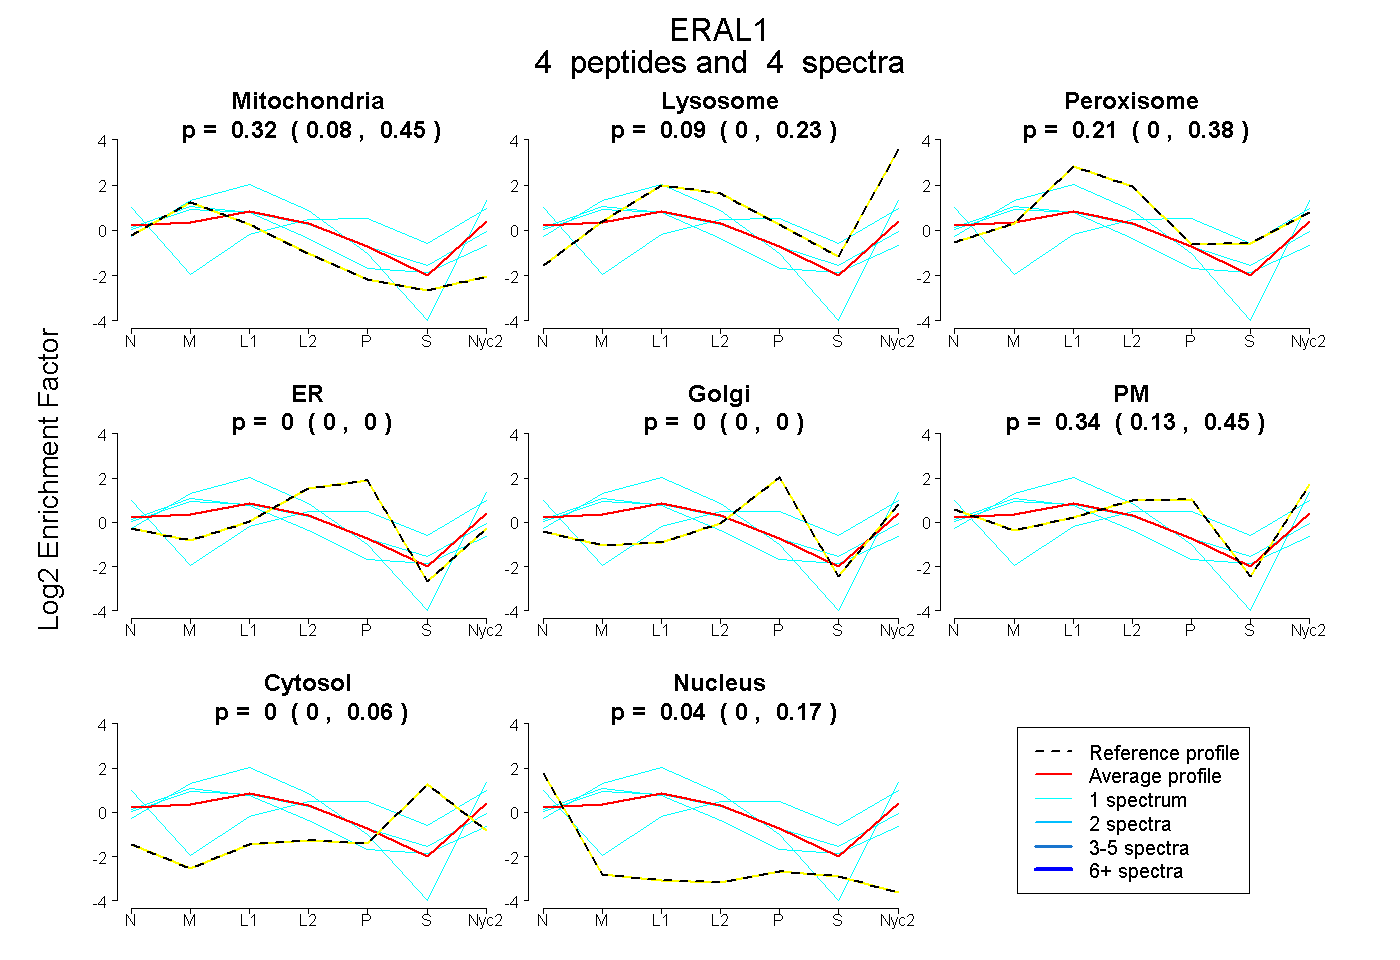
| Plot | Mito | Lyso | Perox | ER | Golgi | PM | Cytosol | Nucleus | |||||
| Expt A |
4 peptides |
4 spectra |
|
0.325 0.081 | 0.449 |
0.086 0.000 | 0.233 |
0.211 0.000 | 0.376 |
0.000 0.000 | 0.000 |
0.000 0.000 | 0.000 |
0.337 0.129 | 0.448 |
0.000 0.000 | 0.055 |
0.041 0.000 | 0.172 |
||
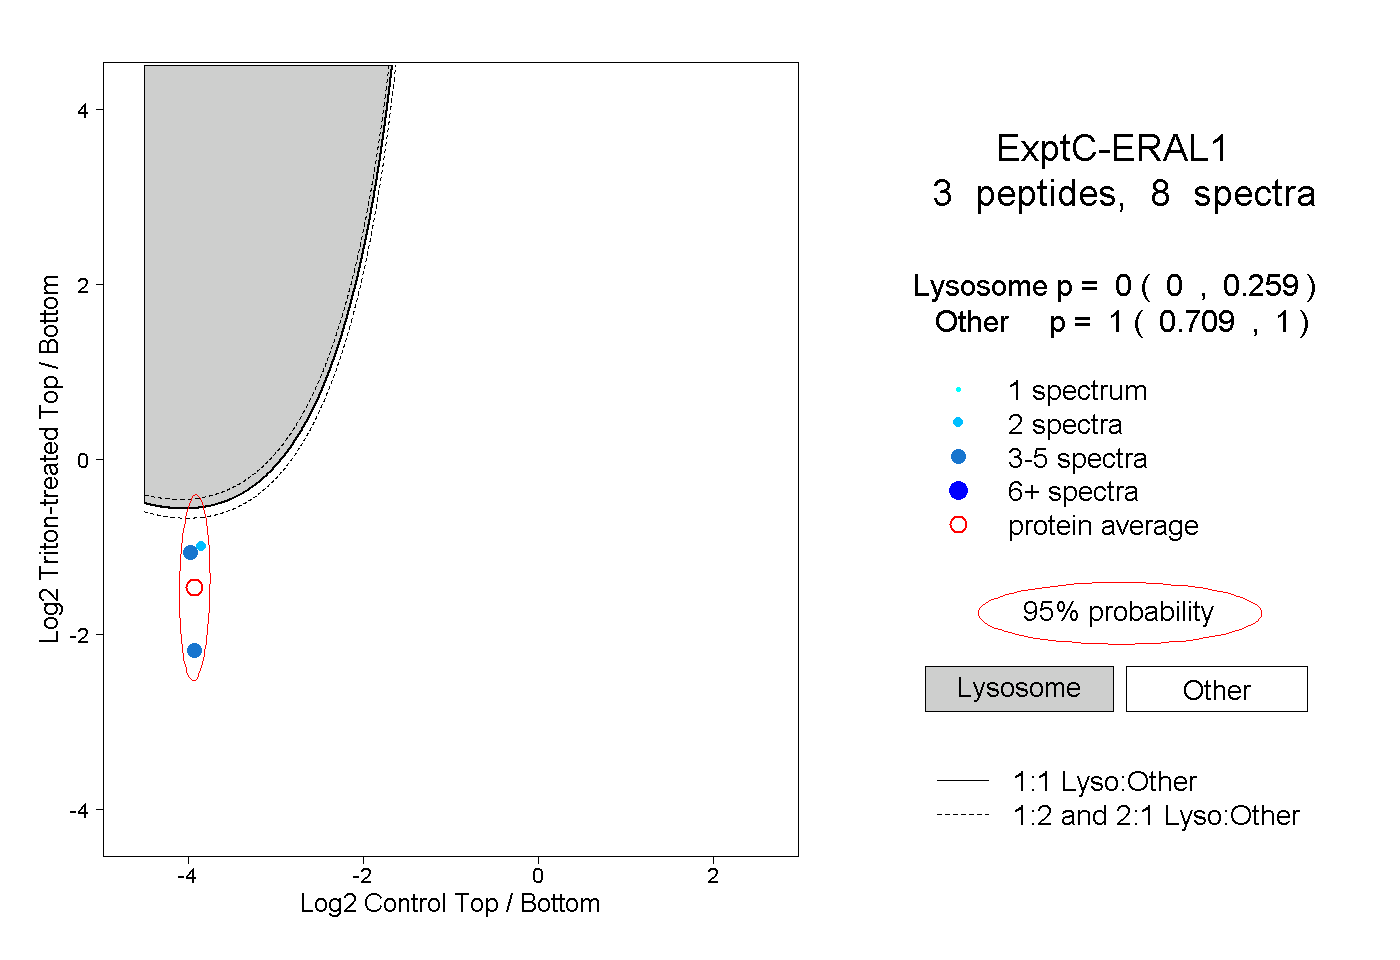
| Plot | Lyso | Other | |||||||||||
| Expt C |
3 peptides |
8 spectra |
|
0.000 0.000 | 0.259 |
1.000 0.709 | 1.000 |