 4
4peptides
spectra
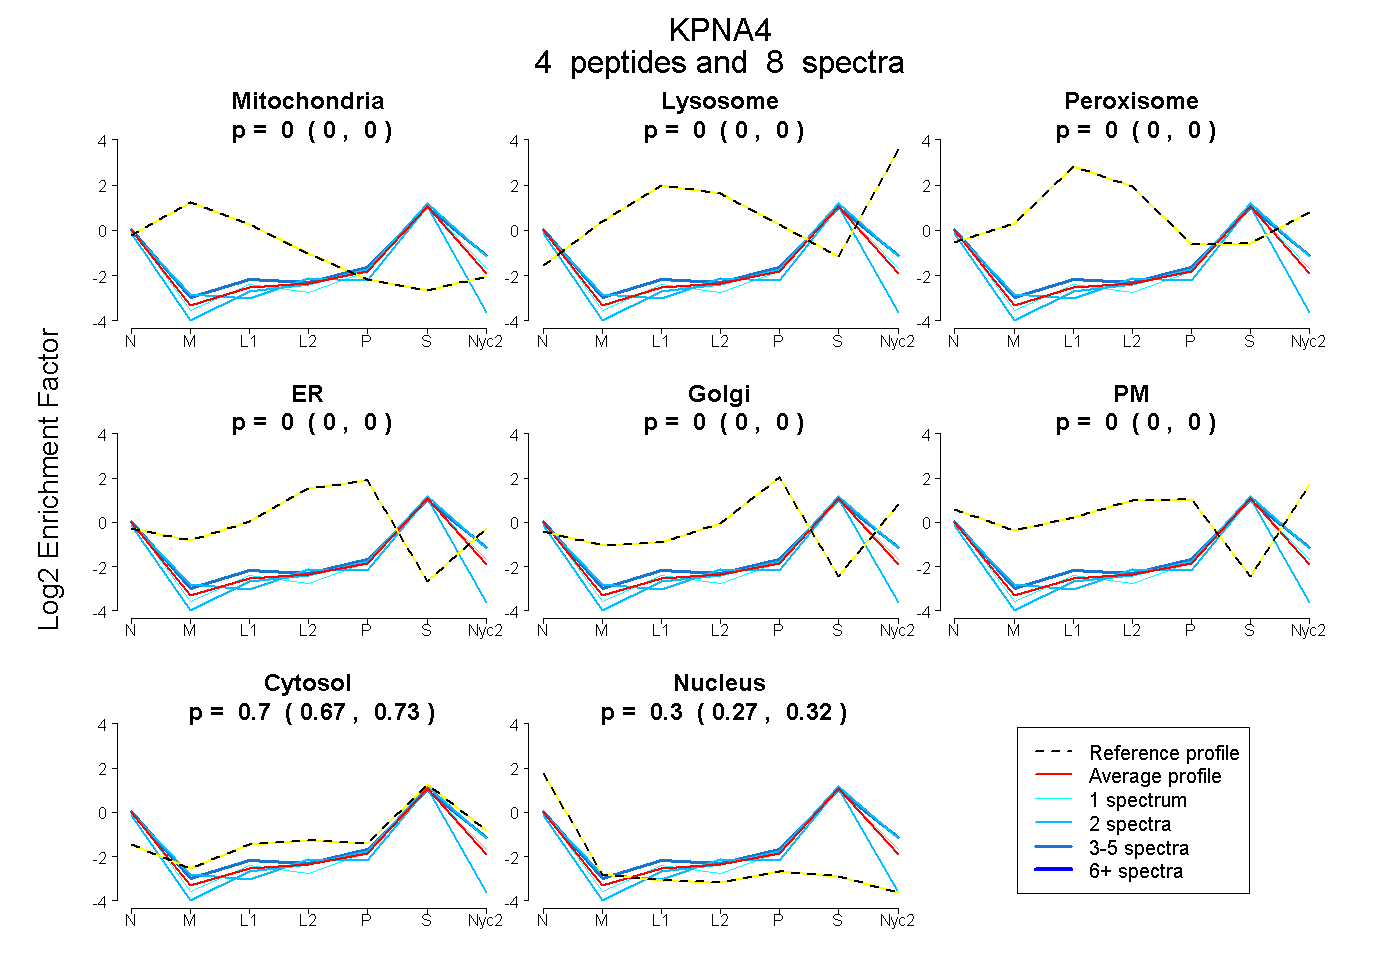
0.000 | 0.000
0.000 | 0.000
0.000 | 0.000
0.000 | 0.000
0.000 | 0.000
0.000 | 0.000
0.675 | 0.728
0.267 | 0.320
4peptides
spectra
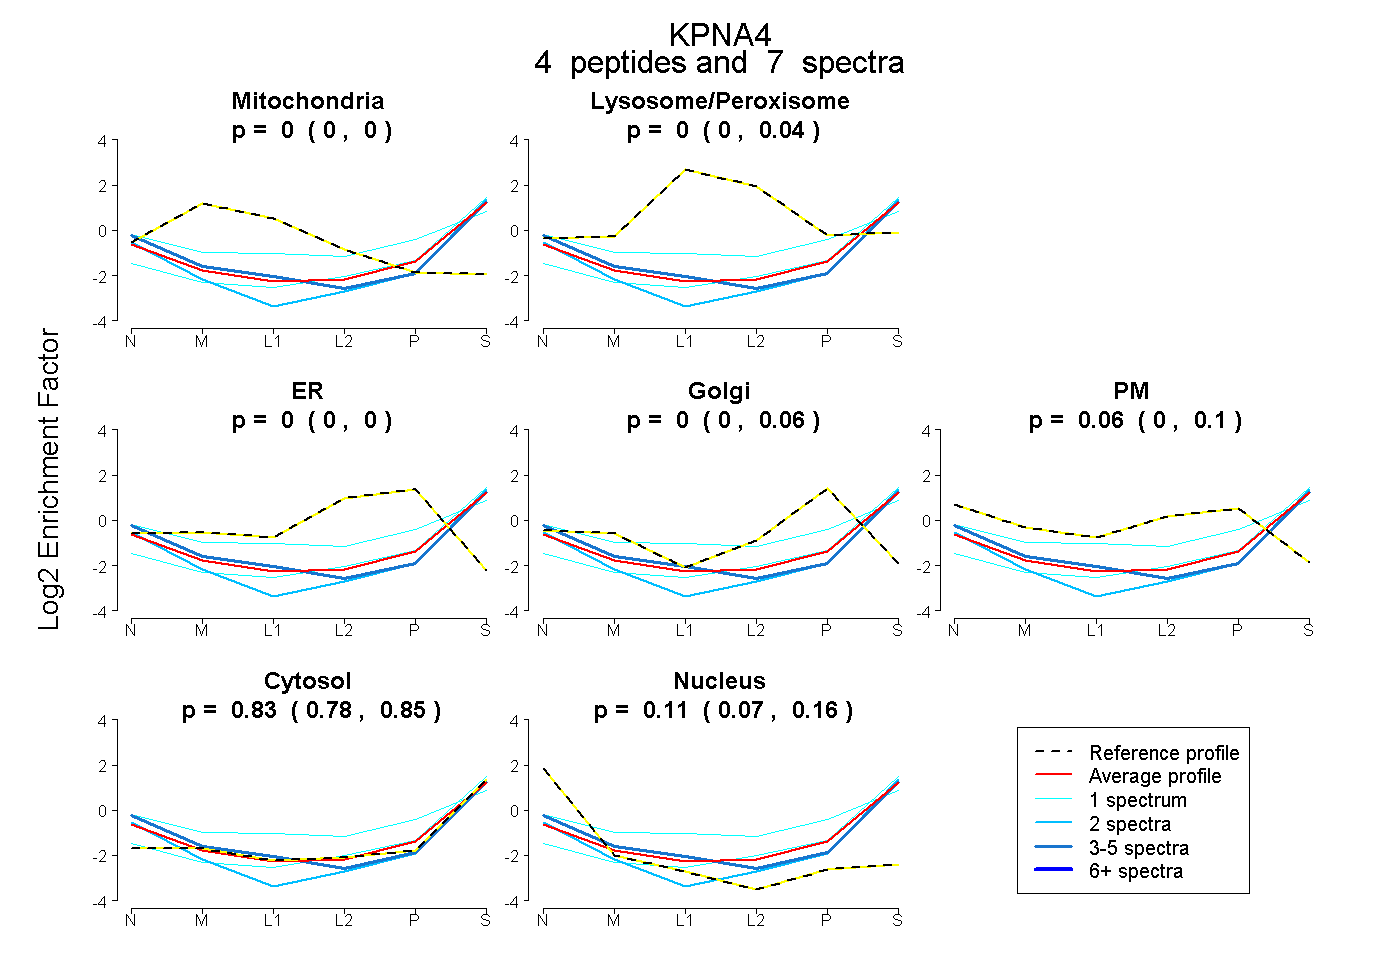
0.000 | 0.000
0.000 | 0.043
0.000 | 0.000
0.000 | 0.059
0.000 | 0.097
0.784 | 0.853
0.070 | 0.158
4peptides
spectra
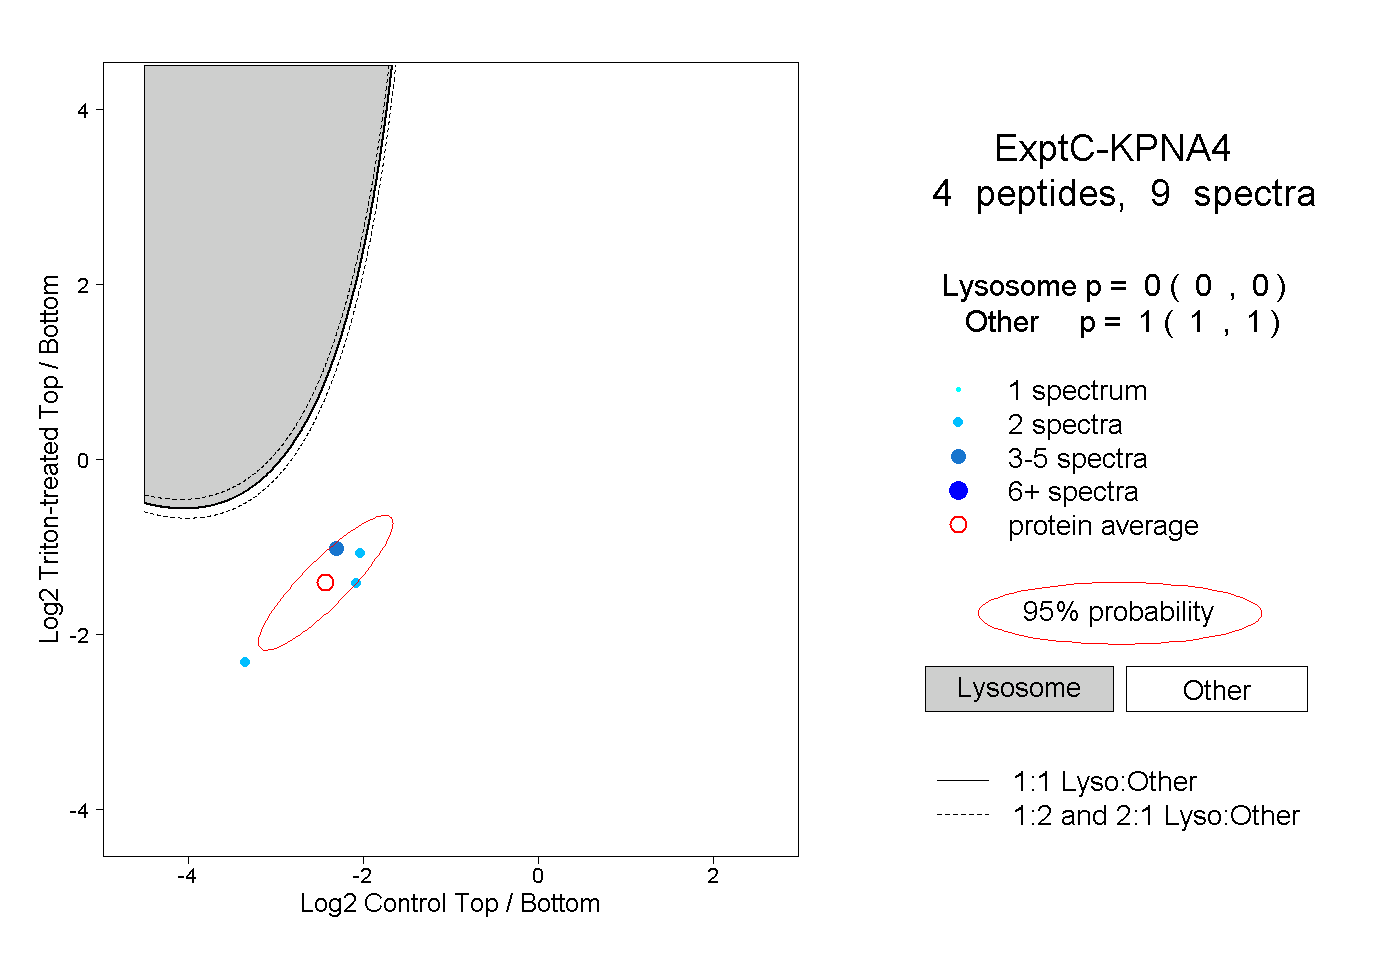
0.000 | 0.000
1.000 | 1.000