PPIF
[ENSRNOP00000014382]
Main page
| | | Plot |
Mito |
Lyso |
|
Perox |
ER |
Golgi |
PM |
Cytosol |
Nucleus |
|
| Expt A |
 8
8
peptides |
16
spectra |
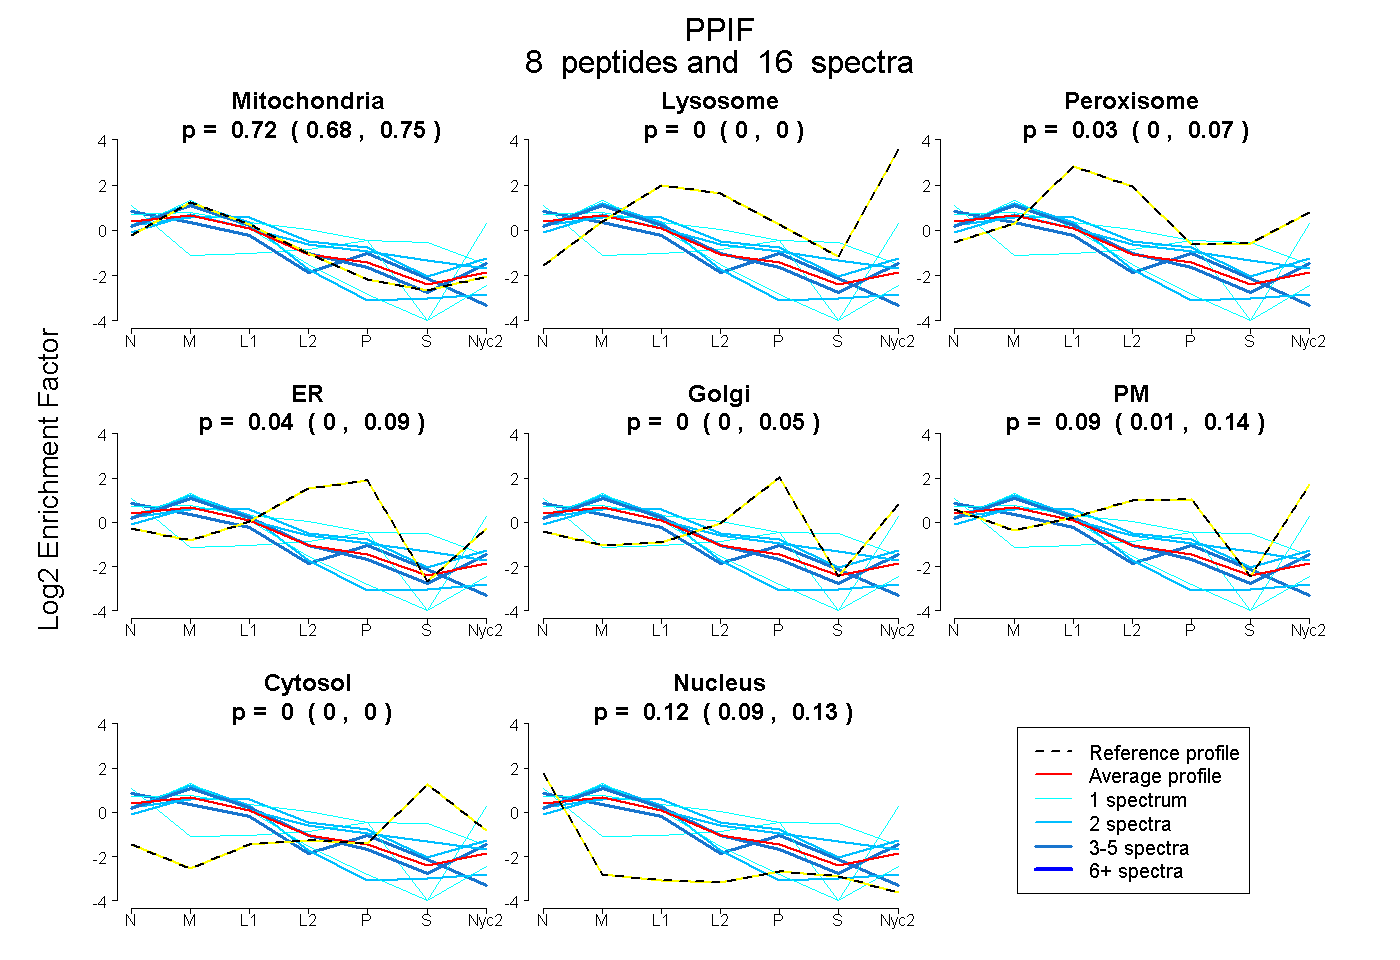 |
0.716
0.675 | 0.749 |
0.000
0.000 | 0.000 |
|
0.033
0.000 | 0.072 |
0.044
0.000 | 0.094 |
0.000
0.000 | 0.051 |
0.092
0.009 | 0.142 |
0.000
0.000 | 0.000 |
0.115
0.091 | 0.135 |
|
| | | Plot |
Mito |
|
Lyso or Perox |
|
ER |
Golgi |
PM |
Cytosol |
Nucleus |
|
| Expt B |
9
peptides |
21
spectra |
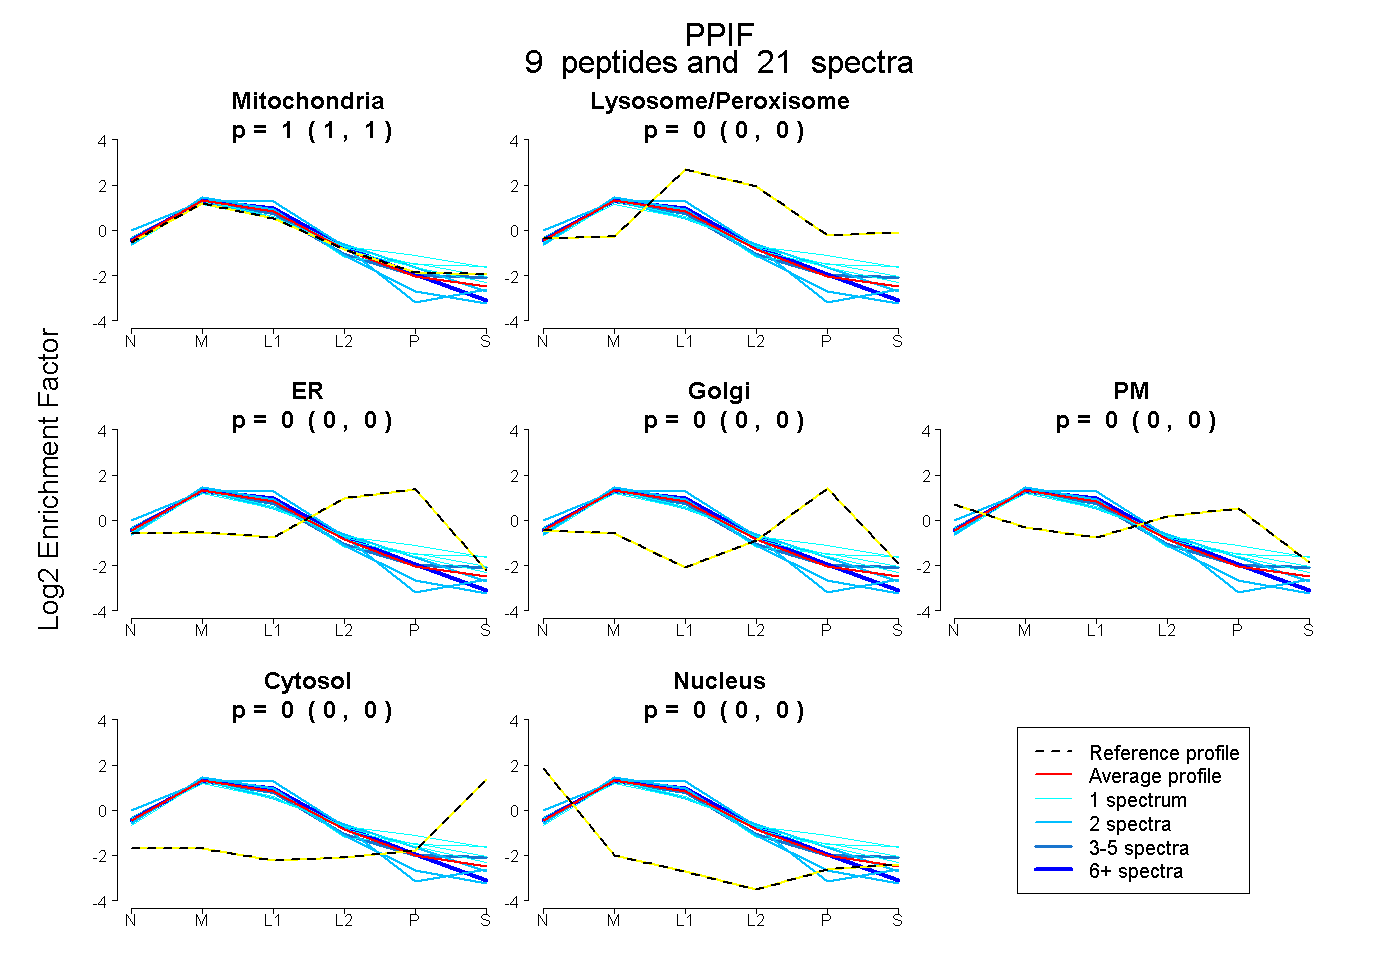 |
1.000
1.000 | 1.000 |
|
0.000
0.000 | 0.000 |
|
0.000
0.000 | 0.000 |
0.000
0.000 | 0.000 |
0.000
0.000 | 0.000 |
0.000
0.000 | 0.000 |
0.000
0.000 | 0.000 |
|
| 6 spectra, HVVFGHVK |
1.000 |
|
0.000 |
|
0.000 |
0.000 |
0.000 |
0.000 |
0.000 |
|
| 1 spectrum, FPDENFTLK |
0.971 |
|
0.006 |
|
0.000 |
0.000 |
0.023 |
0.000 |
0.000 |
|
| 1 spectrum, IVITDCGQLS |
0.904 |
|
0.090 |
|
0.000 |
0.000 |
0.000 |
0.006 |
0.000 |
|
| 1 spectrum, VVLELK |
0.795 |
|
0.092 |
|
0.000 |
0.113 |
0.000 |
0.000 |
0.000 |
|
| 1 spectrum, IESFGSK |
0.969 |
|
0.000 |
|
0.031 |
0.000 |
0.000 |
0.000 |
0.000 |
|
| 2 spectra, SIYGSR |
1.000 |
|
0.000 |
|
0.000 |
0.000 |
0.000 |
0.000 |
0.000 |
|
| 2 spectra, TDWLDGK |
1.000 |
|
0.000 |
|
0.000 |
0.000 |
0.000 |
0.000 |
0.000 |
|
| 5 spectra, ADVVPK |
0.996 |
|
0.000 |
|
0.000 |
0.000 |
0.000 |
0.000 |
0.004 |
|
| 2 spectra, EGMDVVK |
0.940 |
|
0.000 |
|
0.060 |
0.000 |
0.000 |
0.000 |
0.000 |
|
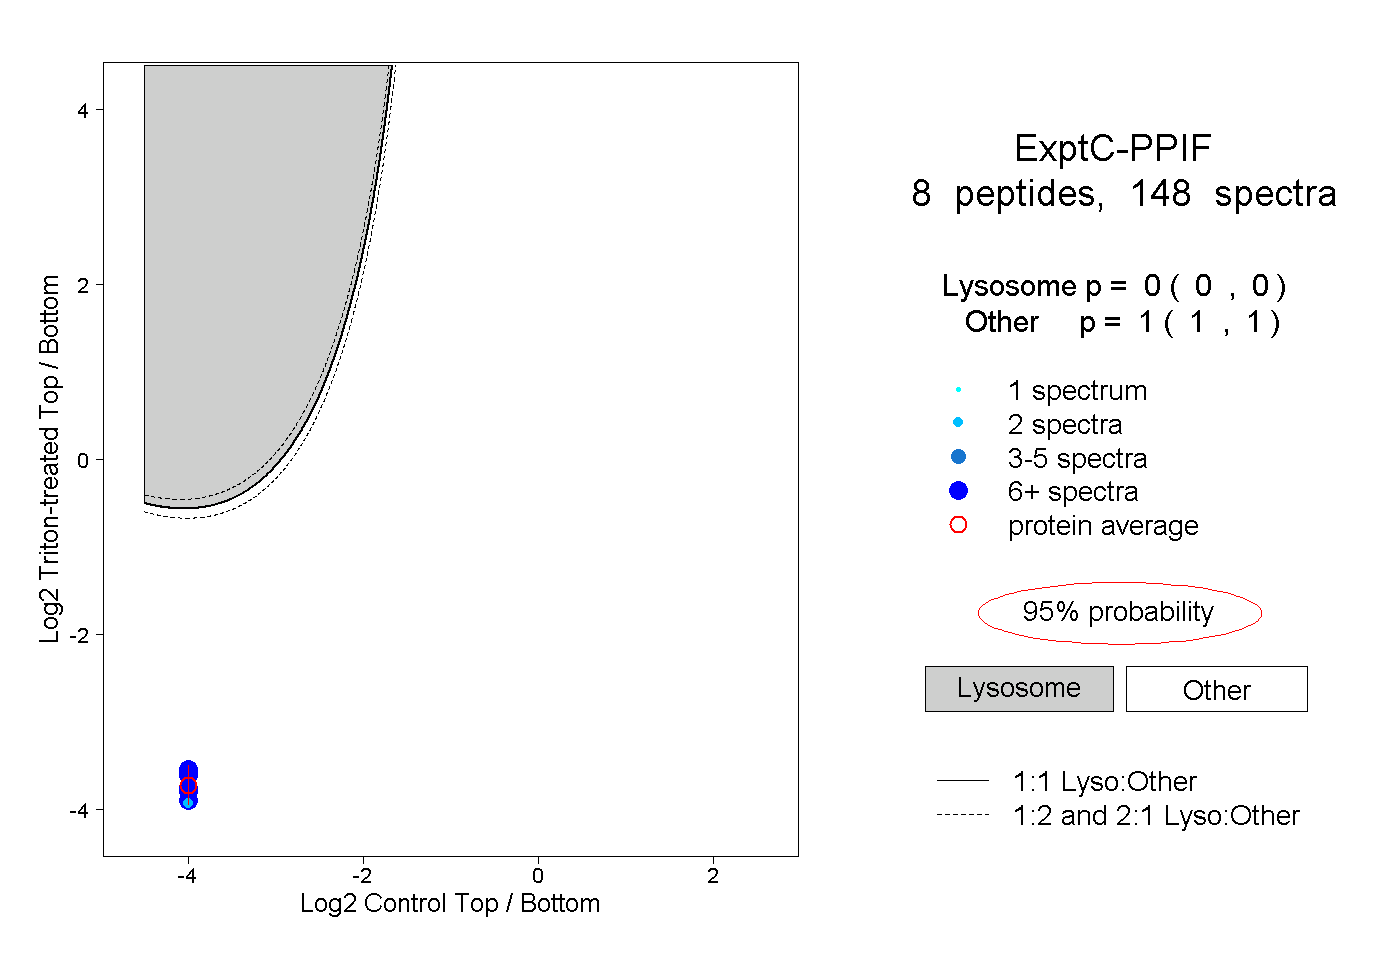
| | | Plot |
|
Lyso |
|
|
|
|
|
|
|
Other |
| Expt C |
8
peptides |
148
spectra |
 |
|
0.000
0.000 | 0.000 |
|
|
|
|
|
|
|
1.000
1.000 | 1.000 |
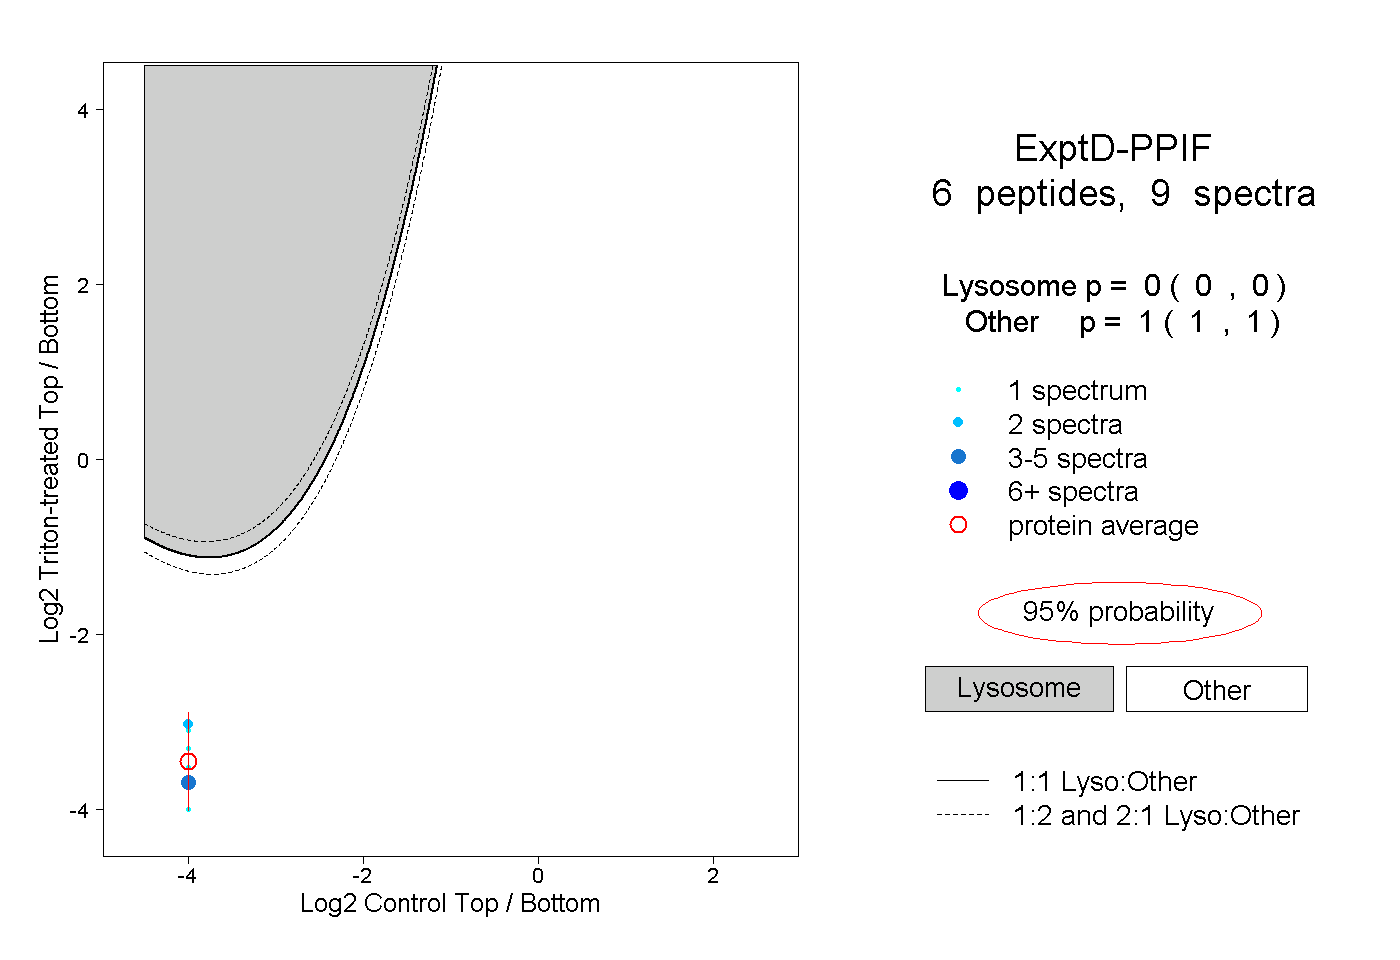
| | | Plot |
|
Lyso |
|
|
|
|
|
|
|
Other |
| Expt D |
6
peptides |
9
spectra |
 |
|
0.000
0.000 | 0.000 |
|
|
|
|
|
|
|
1.000
1.000 | 1.000 |