 2
2peptides
spectra
0.000 | 0.000
0.188 | 0.321
0.000 | 0.037
0.000 | 0.000
0.000 | 0.000
0.275 | 0.370
0.366 | 0.429
0.000 | 0.000
2peptides
spectra
0.000 | 0.000
1.000 | 1.000
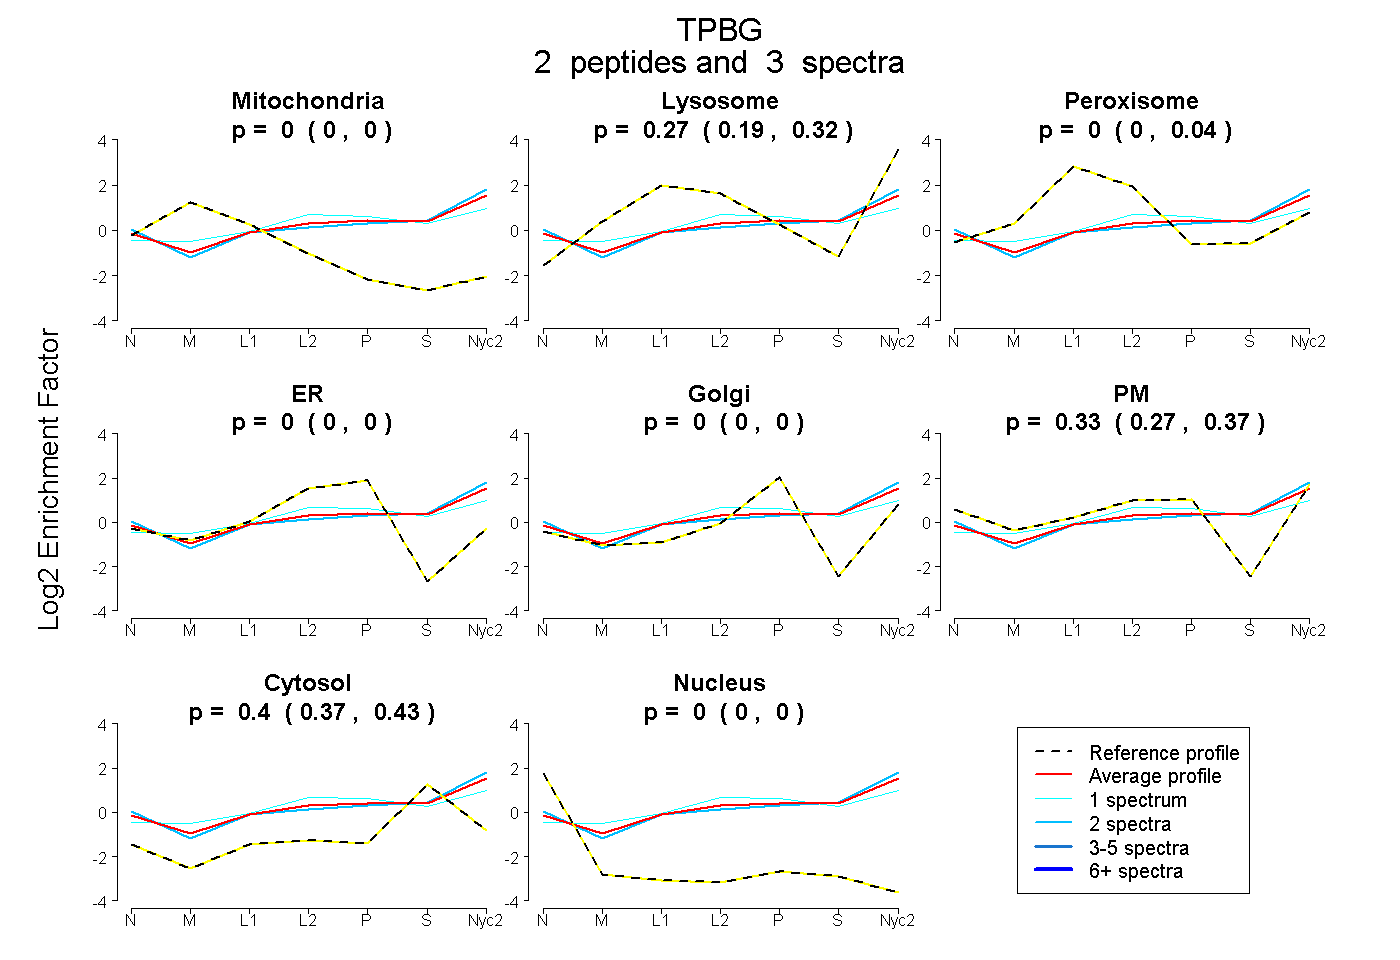
| Plot | Mito | Lyso | Perox | ER | Golgi | PM | Cytosol | Nucleus | |||||
| Expt A |
2 peptides |
3 spectra |
|
0.000 0.000 | 0.000 |
0.271 0.188 | 0.321 |
0.000 0.000 | 0.037 |
0.000 0.000 | 0.000 |
0.000 0.000 | 0.000 |
0.328 0.275 | 0.370 |
0.401 0.366 | 0.429 |
0.000 0.000 | 0.000 |
||
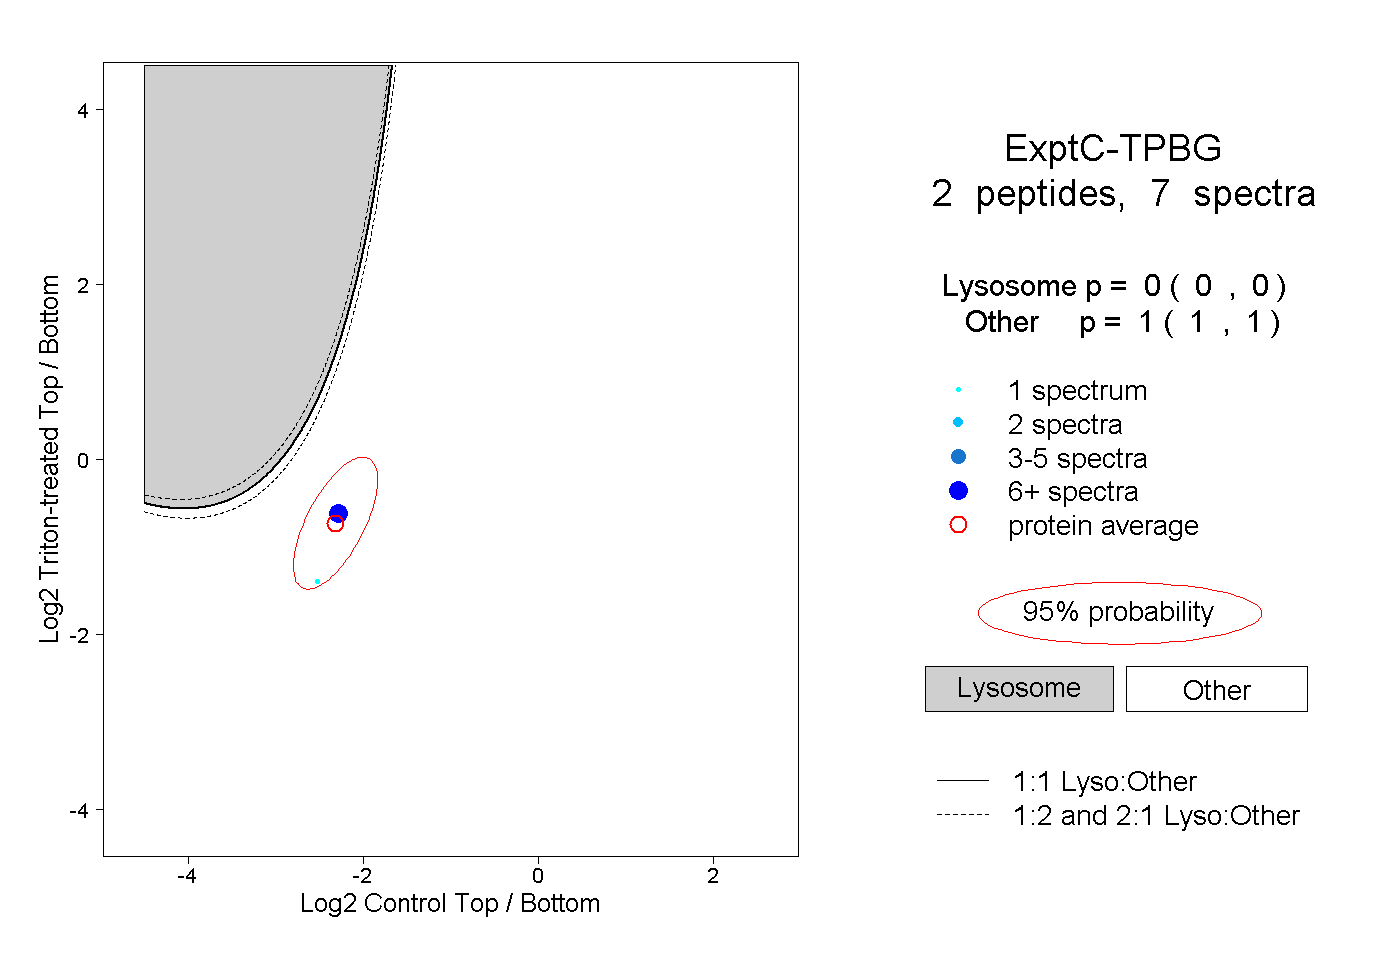
| Plot | Lyso | Other | |||||||||||
| Expt C |
2 peptides |
7 spectra |
|
0.000 0.000 | 0.000 |
1.000 1.000 | 1.000 |