11
11peptides
spectra
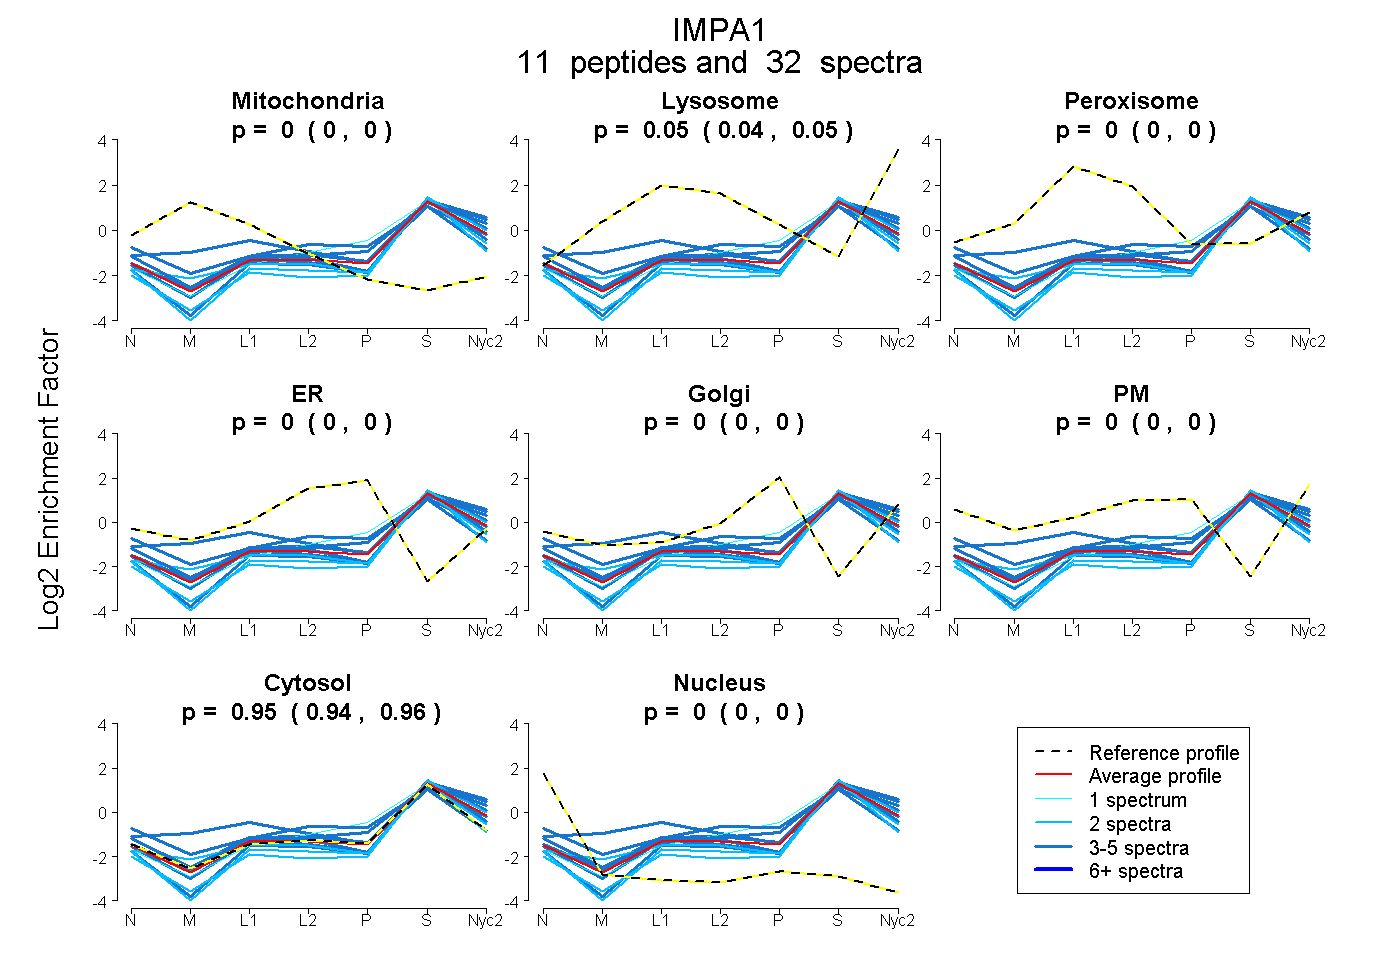
0.000 | 0.000
0.042 | 0.055
0.000 | 0.000
0.000 | 0.000
0.000 | 0.000
0.000 | 0.000
0.944 | 0.957
0.000 | 0.000
7peptides
spectra
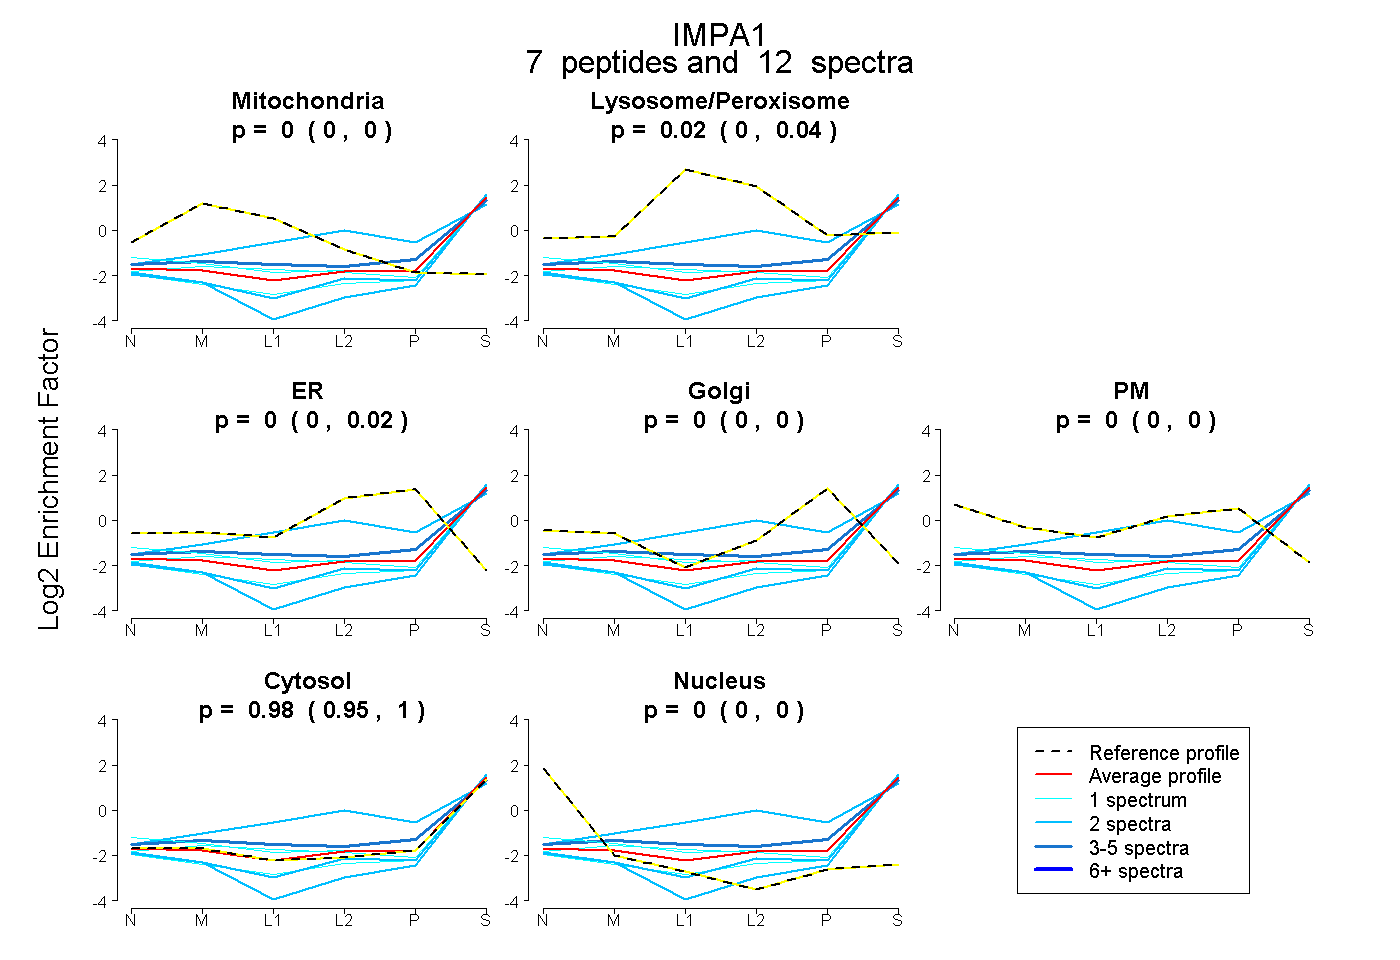
0.000 | 0.000
0.000 | 0.045
0.000 | 0.017
0.000 | 0.000
0.000 | 0.000
0.950 | 1.000
0.000 | 0.000