 11
11peptides
spectra
0.000 | 0.000
0.042 | 0.055
0.000 | 0.000
0.000 | 0.000
0.000 | 0.000
0.000 | 0.000
0.944 | 0.957
0.000 | 0.000
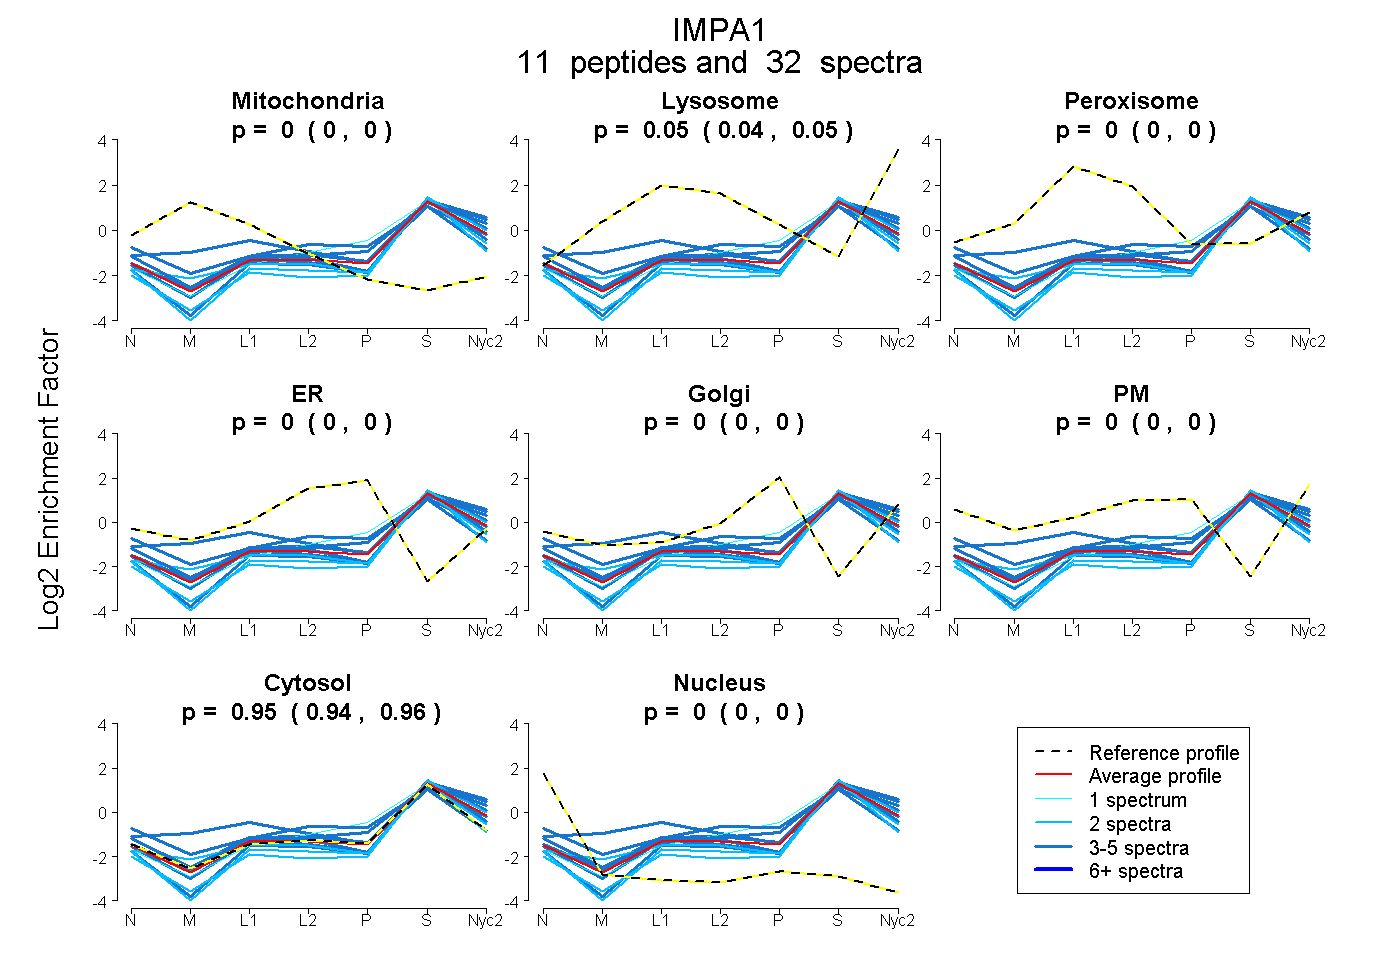
| Plot | Mito | Lyso | Perox | ER | Golgi | PM | Cytosol | Nucleus | |||||
| Expt A |
11 peptides |
32 spectra |
|
0.000 0.000 | 0.000 |
0.049 0.042 | 0.055 |
0.000 0.000 | 0.000 |
0.000 0.000 | 0.000 |
0.000 0.000 | 0.000 |
0.000 0.000 | 0.000 |
0.951 0.944 | 0.957 |
0.000 0.000 | 0.000 |
| 2 spectra, TVFTEQPTWIIDPIDGTTNFVHR | 0.023 | 0.005 | 0.000 | 0.000 | 0.000 | 0.000 | 0.972 | 0.000 | ||
| 2 spectra, SLLVTELGSSR | 0.000 | 0.000 | 0.000 | 0.000 | 0.000 | 0.000 | 1.000 | 0.000 | ||
| 3 spectra, VSQQEDITK | 0.000 | 0.110 | 0.000 | 0.000 | 0.021 | 0.000 | 0.869 | 0.000 | ||
| 3 spectra, ELEIIPLQR | 0.000 | 0.000 | 0.000 | 0.000 | 0.000 | 0.000 | 1.000 | 0.000 | ||
| 5 spectra, IVLSNMER | 0.000 | 0.131 | 0.000 | 0.000 | 0.000 | 0.000 | 0.869 | 0.000 | ||
| 4 spectra, QAGEMIR | 0.000 | 0.018 | 0.020 | 0.000 | 0.000 | 0.169 | 0.793 | 0.000 | ||
| 4 spectra, IIAASNIALAER | 0.000 | 0.097 | 0.000 | 0.000 | 0.000 | 0.000 | 0.903 | 0.000 | ||
| 3 spectra, LCSIPIHGIR | 0.141 | 0.000 | 0.159 | 0.000 | 0.000 | 0.000 | 0.700 | 0.000 | ||
| 1 spectrum, MLMSSIK | 0.000 | 0.037 | 0.000 | 0.000 | 0.084 | 0.000 | 0.879 | 0.000 | ||
| 3 spectra, KPETLR | 0.000 | 0.032 | 0.000 | 0.000 | 0.000 | 0.000 | 0.968 | 0.000 | ||
| 2 spectra, MDVMIK | 0.000 | 0.000 | 0.000 | 0.000 | 0.000 | 0.000 | 0.977 | 0.023 |
| Plot | Mito | Lyso or Perox | ER | Golgi | PM | Cytosol | Nucleus | ||||||
| Expt B |
7 peptides |
12 spectra |
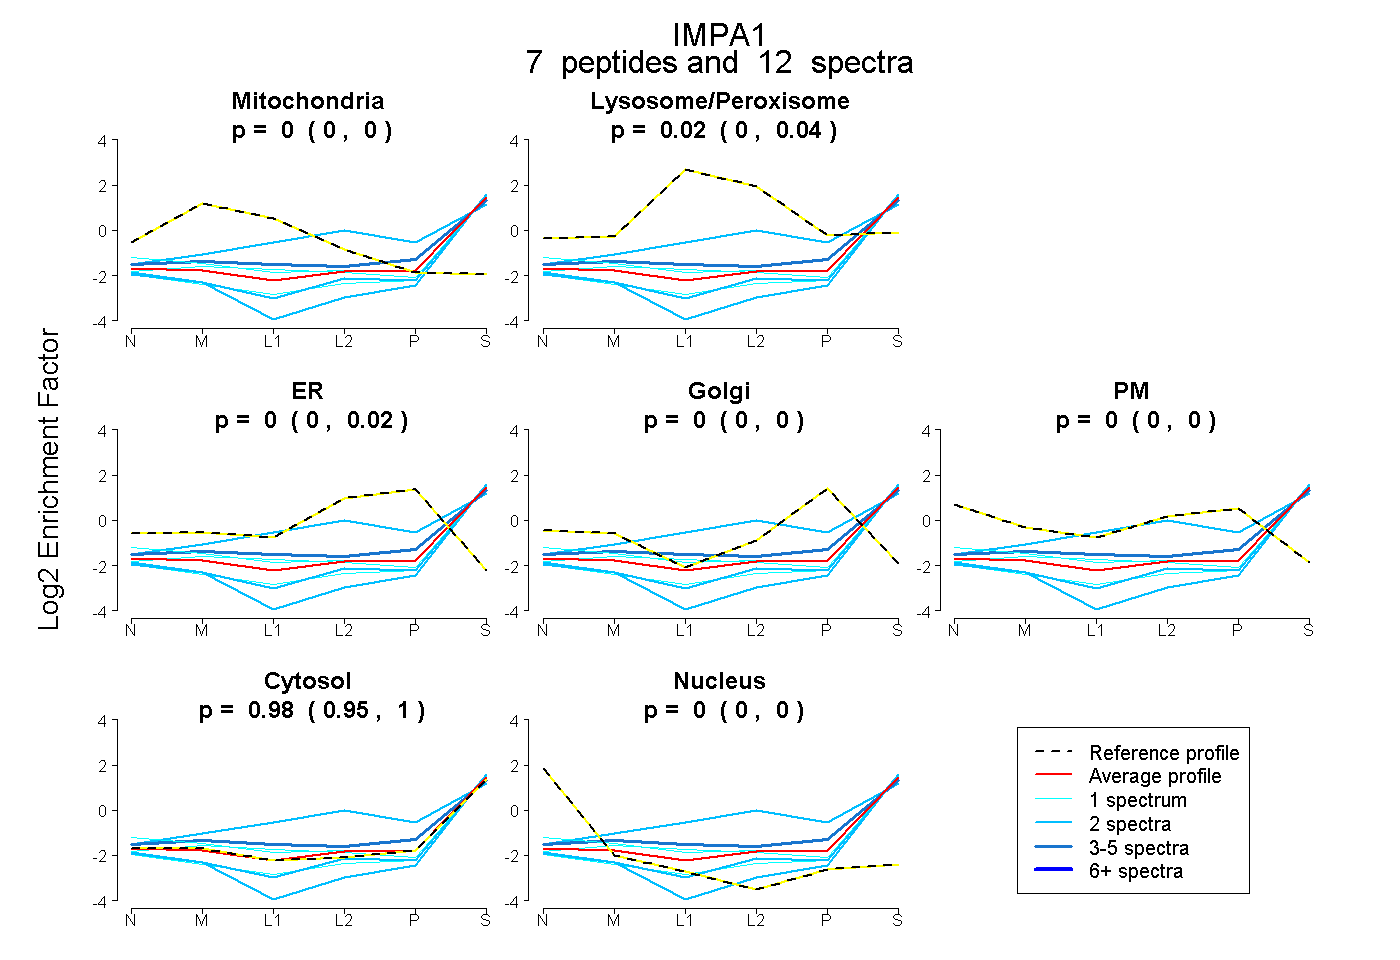 |
0.000 0.000 | 0.000 |
0.020 0.000 | 0.045 |
0.000 0.000 | 0.017 |
0.000 0.000 | 0.000 |
0.000 0.000 | 0.000 |
0.980 0.950 | 1.000 |
0.000 0.000 | 0.000 |
|||
| Plot | Lyso | Other | |||||||||||
| Expt C |
9 peptides |
20 spectra |
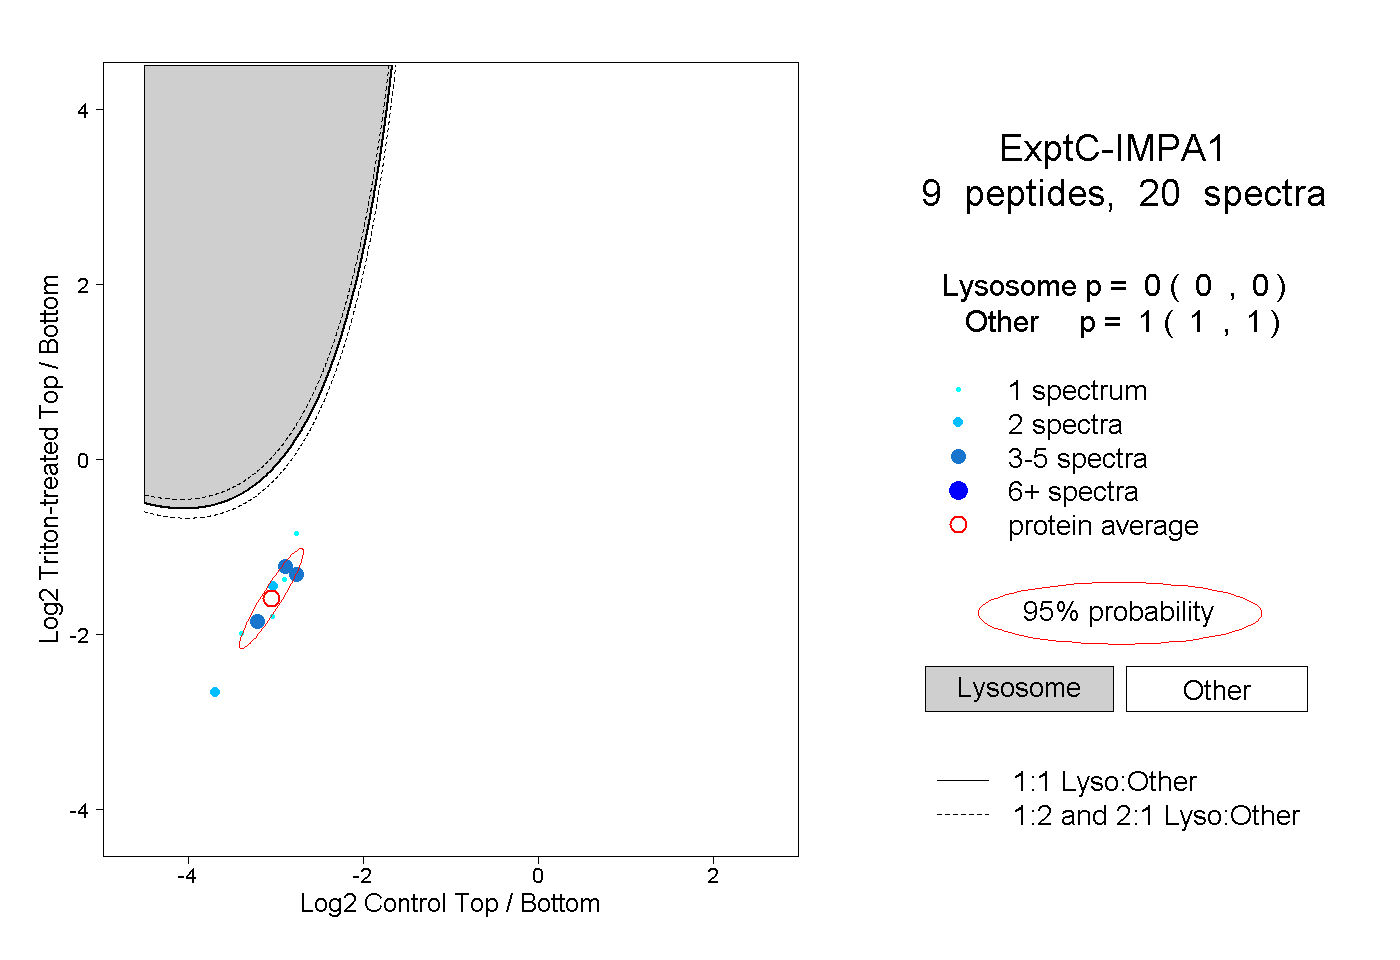 |
0.000 0.000 | 0.000 |
1.000 1.000 | 1.000 |