 7
7peptides
spectra
0.000 | 0.000
0.973 | 0.986
0.000 | 0.000
0.000 | 0.000
0.000 | 0.000
0.000 | 0.000
0.012 | 0.026
0.000 | 0.000
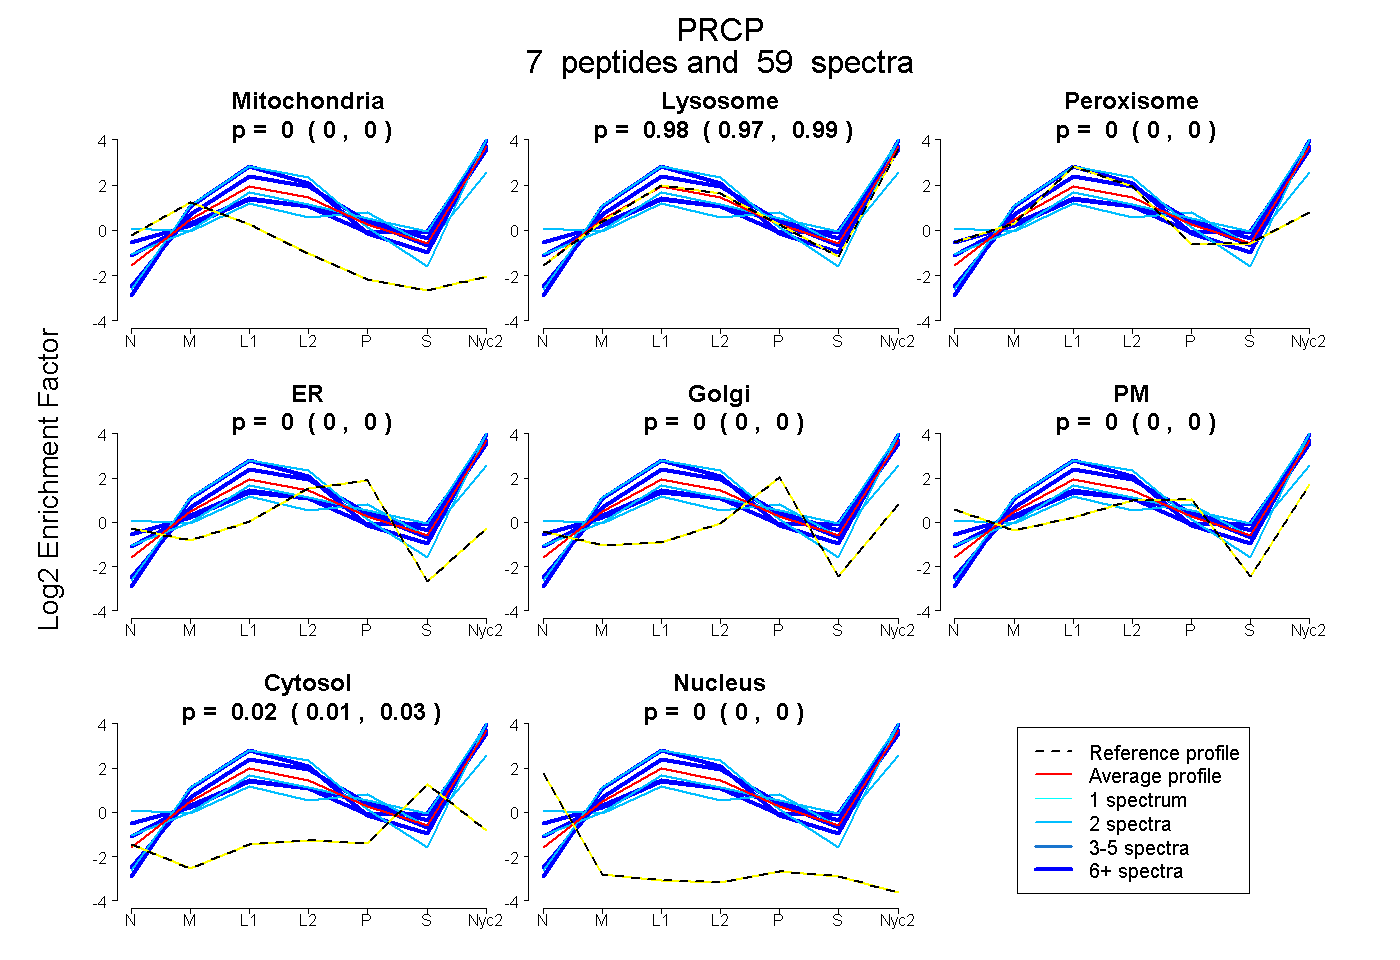
| Plot | Mito | Lyso | Perox | ER | Golgi | PM | Cytosol | Nucleus | |||||
| Expt A |
7 peptides |
59 spectra |
|
0.000 0.000 | 0.000 |
0.981 0.973 | 0.986 |
0.000 0.000 | 0.000 |
0.000 0.000 | 0.000 |
0.000 0.000 | 0.000 |
0.000 0.000 | 0.000 |
0.019 0.012 | 0.026 |
0.000 0.000 | 0.000 |
| 10 spectra, AHNAFDPSSVLLSR | 0.000 | 0.801 | 0.000 | 0.000 | 0.000 | 0.123 | 0.075 | 0.000 | ||
| 2 spectra, YLVADK | 0.000 | 1.000 | 0.000 | 0.000 | 0.000 | 0.000 | 0.000 | 0.000 | ||
| 14 spectra, SLPFGR | 0.000 | 1.000 | 0.000 | 0.000 | 0.000 | 0.000 | 0.000 | 0.000 | ||
| 13 spectra, AMLVFAEHR | 0.000 | 0.886 | 0.000 | 0.000 | 0.000 | 0.000 | 0.114 | 0.000 | ||
| 16 spectra, SWSVINR | 0.000 | 1.000 | 0.000 | 0.000 | 0.000 | 0.000 | 0.000 | 0.000 | ||
| 2 spectra, VDHFGFSDTR | 0.000 | 0.928 | 0.000 | 0.000 | 0.000 | 0.000 | 0.072 | 0.000 | ||
| 2 spectra, DFSQSGPHCSESIR | 0.000 | 0.462 | 0.024 | 0.000 | 0.000 | 0.408 | 0.106 | 0.000 |
| Plot | Mito | Lyso or Perox | ER | Golgi | PM | Cytosol | Nucleus | ||||||
| Expt B |
6 peptides |
21 spectra |
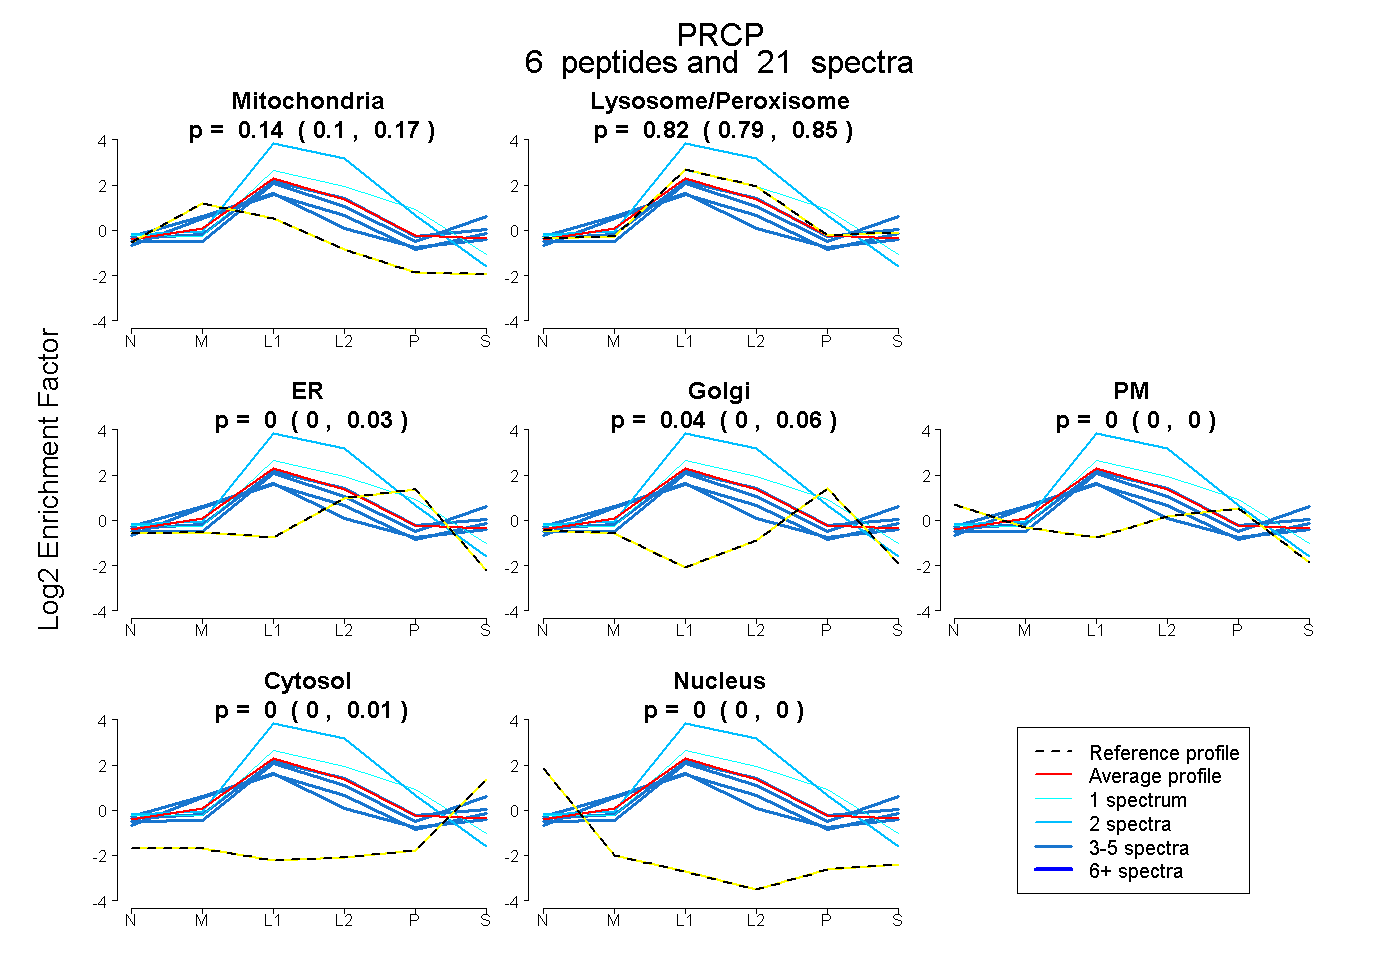 |
0.138 0.102 | 0.168 |
0.823 0.788 | 0.849 |
0.000 0.000 | 0.029 |
0.039 0.000 | 0.060 |
0.000 0.000 | 0.000 |
0.000 0.000 | 0.012 |
0.000 0.000 | 0.000 |
|||
| Plot | Lyso | Other | |||||||||||
| Expt C |
7 peptides |
55 spectra |
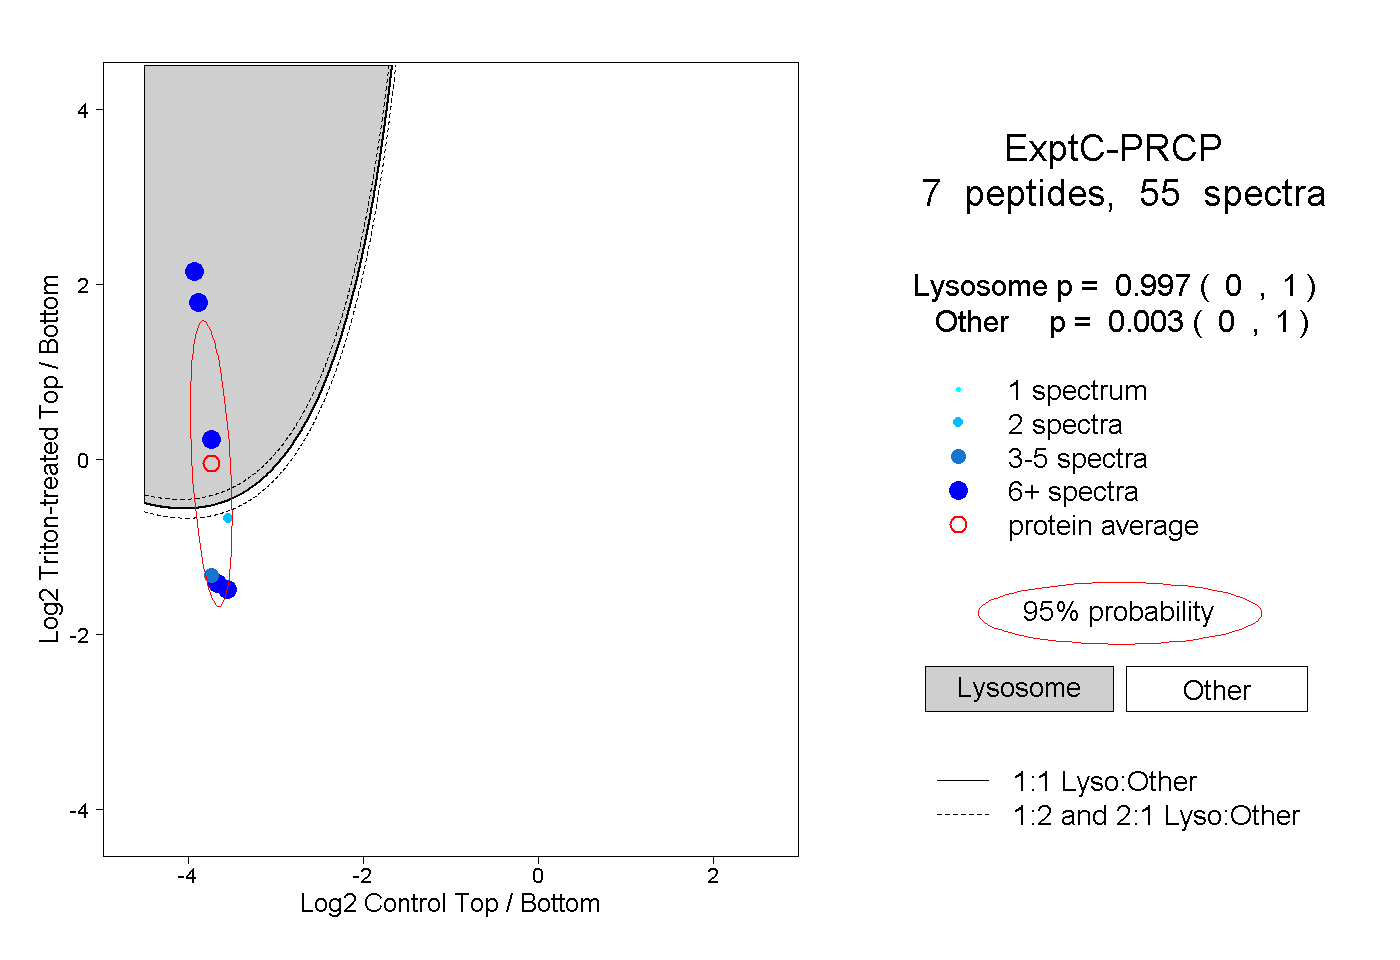 |
0.997 0.000 | 1.000 |
0.003 0.000 | 1.000 |
||||||||
| Plot | Lyso | Other | |||||||||||
| Expt D |
4 peptides |
12 spectra |
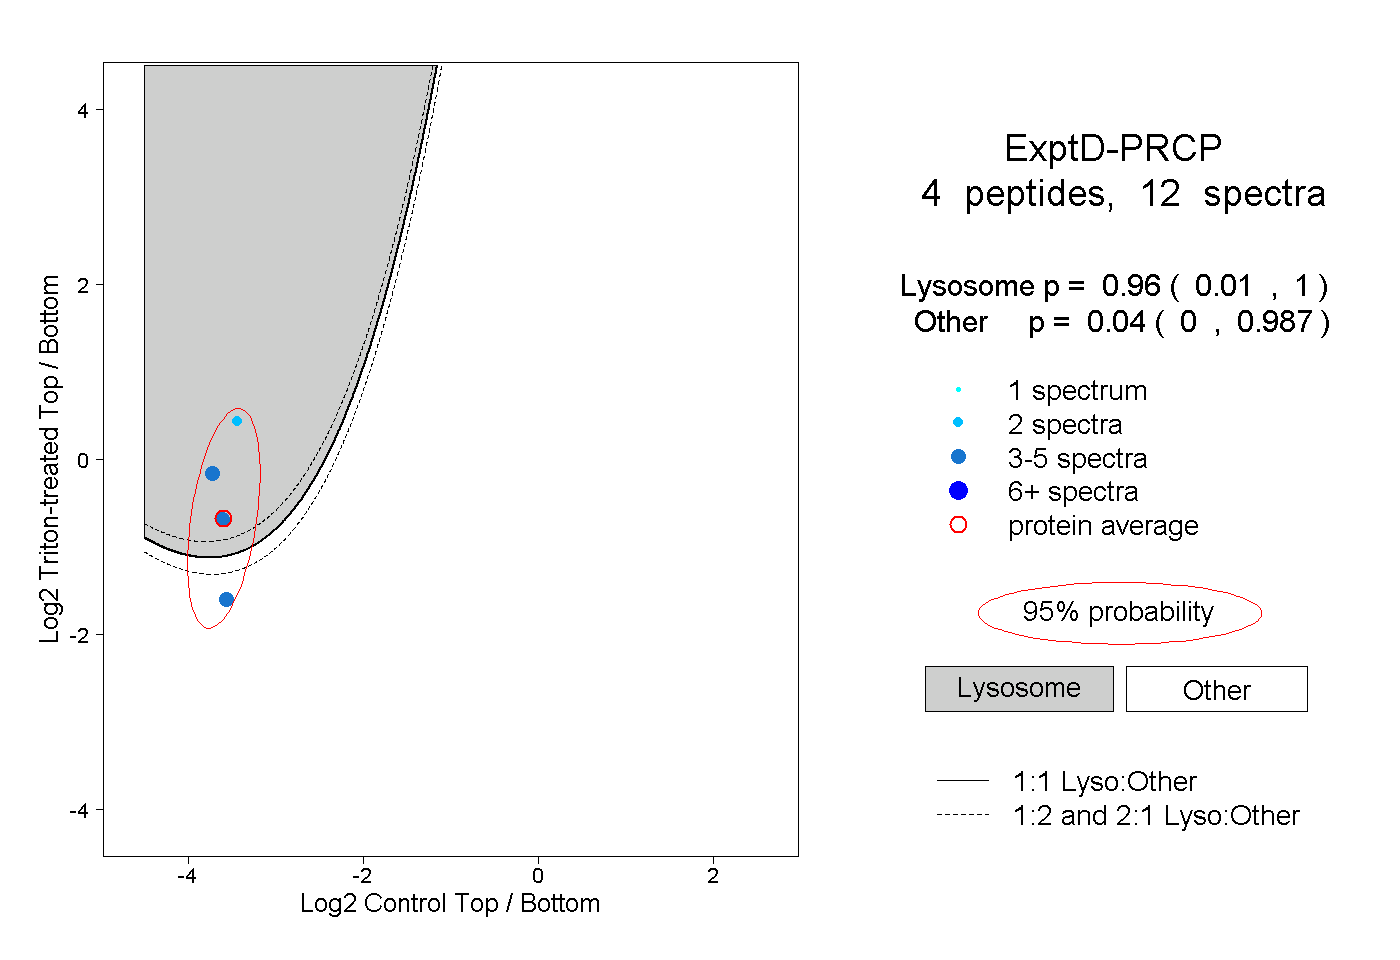 |
0.960 0.010 | 1.000 |
0.040 0.000 | 0.987 |