 4
4peptides
spectra
0.000 | 0.000
0.179 | 0.226
0.000 | 0.000
0.000 | 0.000
0.093 | 0.167
0.253 | 0.330
0.347 | 0.382
0.000 | 0.000
2peptides
spectra
0.704 | 1.000
0.000 | 0.295
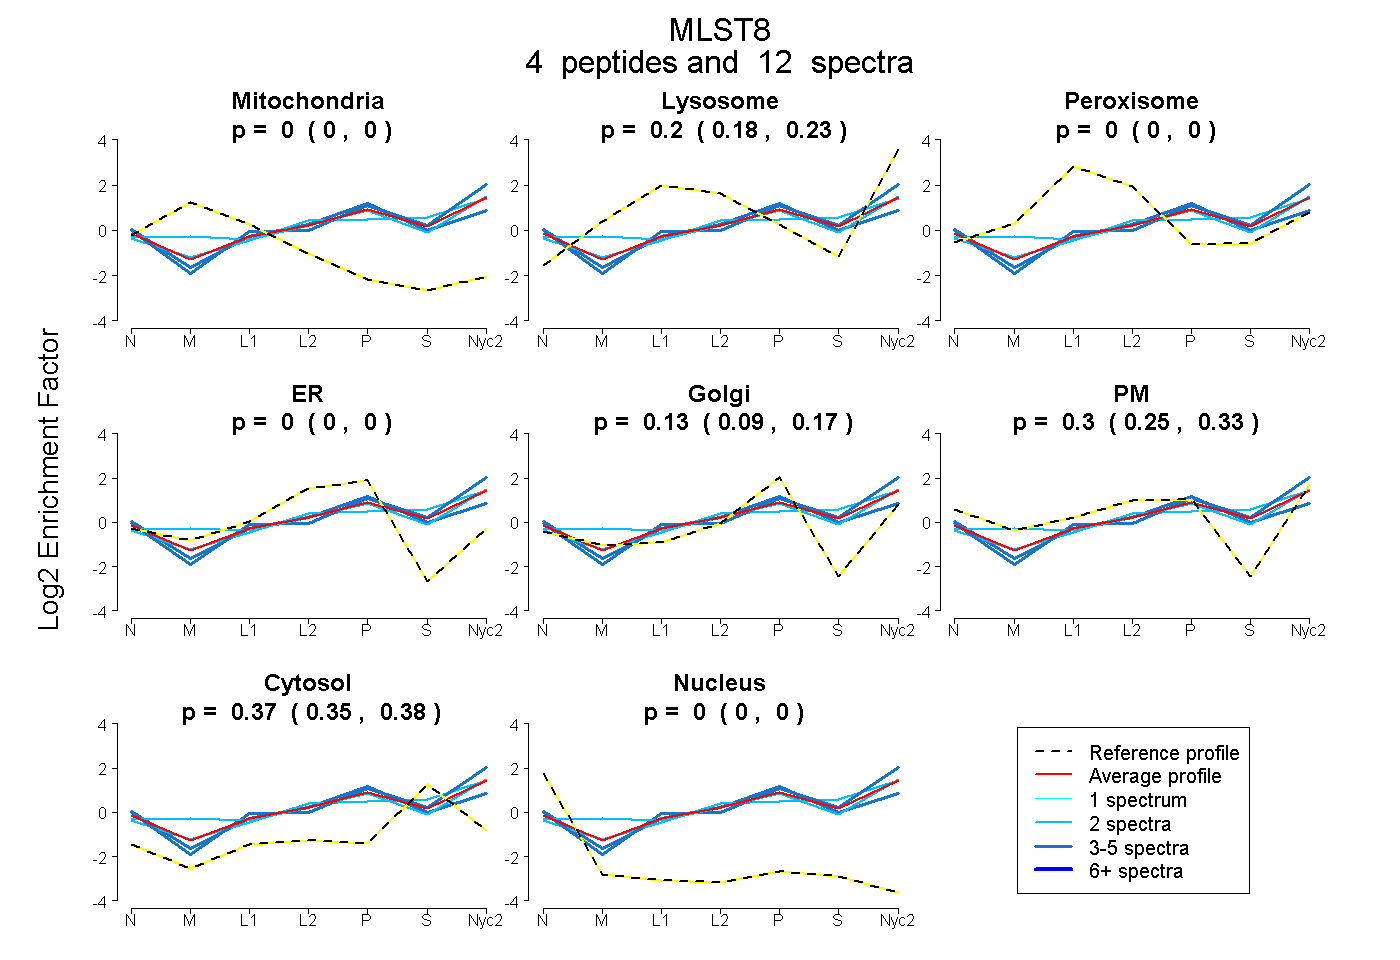
| Plot | Mito | Lyso | Perox | ER | Golgi | PM | Cytosol | Nucleus | |||||
| Expt A |
4 peptides |
12 spectra |
|
0.000 0.000 | 0.000 |
0.205 0.179 | 0.226 |
0.000 0.000 | 0.000 |
0.000 0.000 | 0.000 |
0.134 0.093 | 0.167 |
0.296 0.253 | 0.330 |
0.366 0.347 | 0.382 |
0.000 0.000 | 0.000 |
||
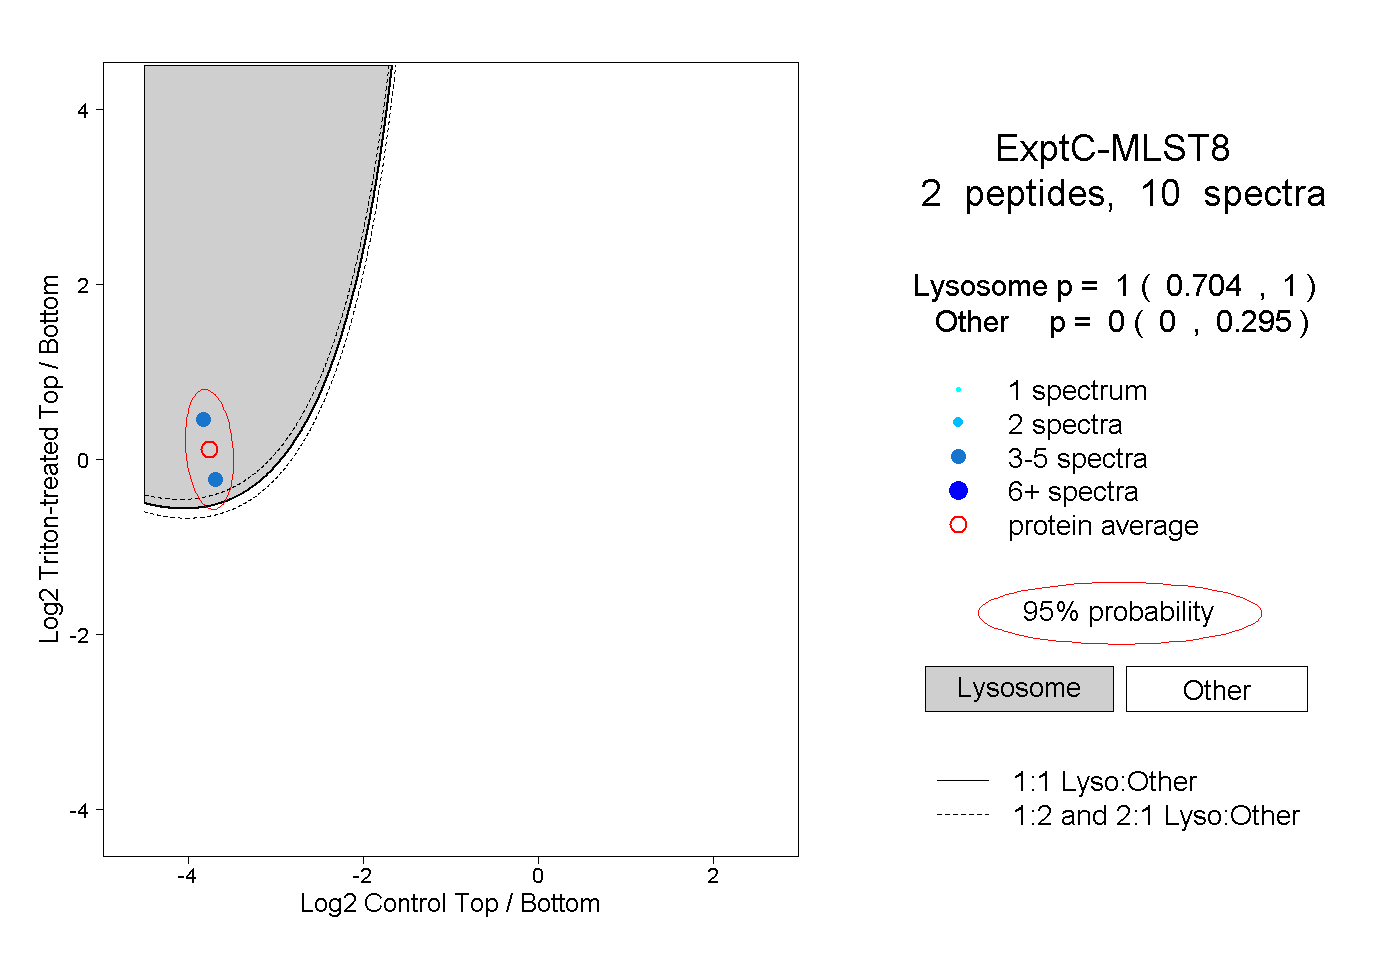
| Plot | Lyso | Other | |||||||||||
| Expt C |
2 peptides |
10 spectra |
|
1.000 0.704 | 1.000 |
0.000 0.000 | 0.295 |