 6
6peptides
spectra
0.000 | 0.000
0.000 | 0.000
0.000 | 0.005
0.141 | 0.325
0.013 | 0.202
0.000 | 0.000
0.623 | 0.663
0.000 | 0.000
| Plot | Mito | Lyso | Perox | ER | Golgi | PM | Cytosol | Nucleus | |||||
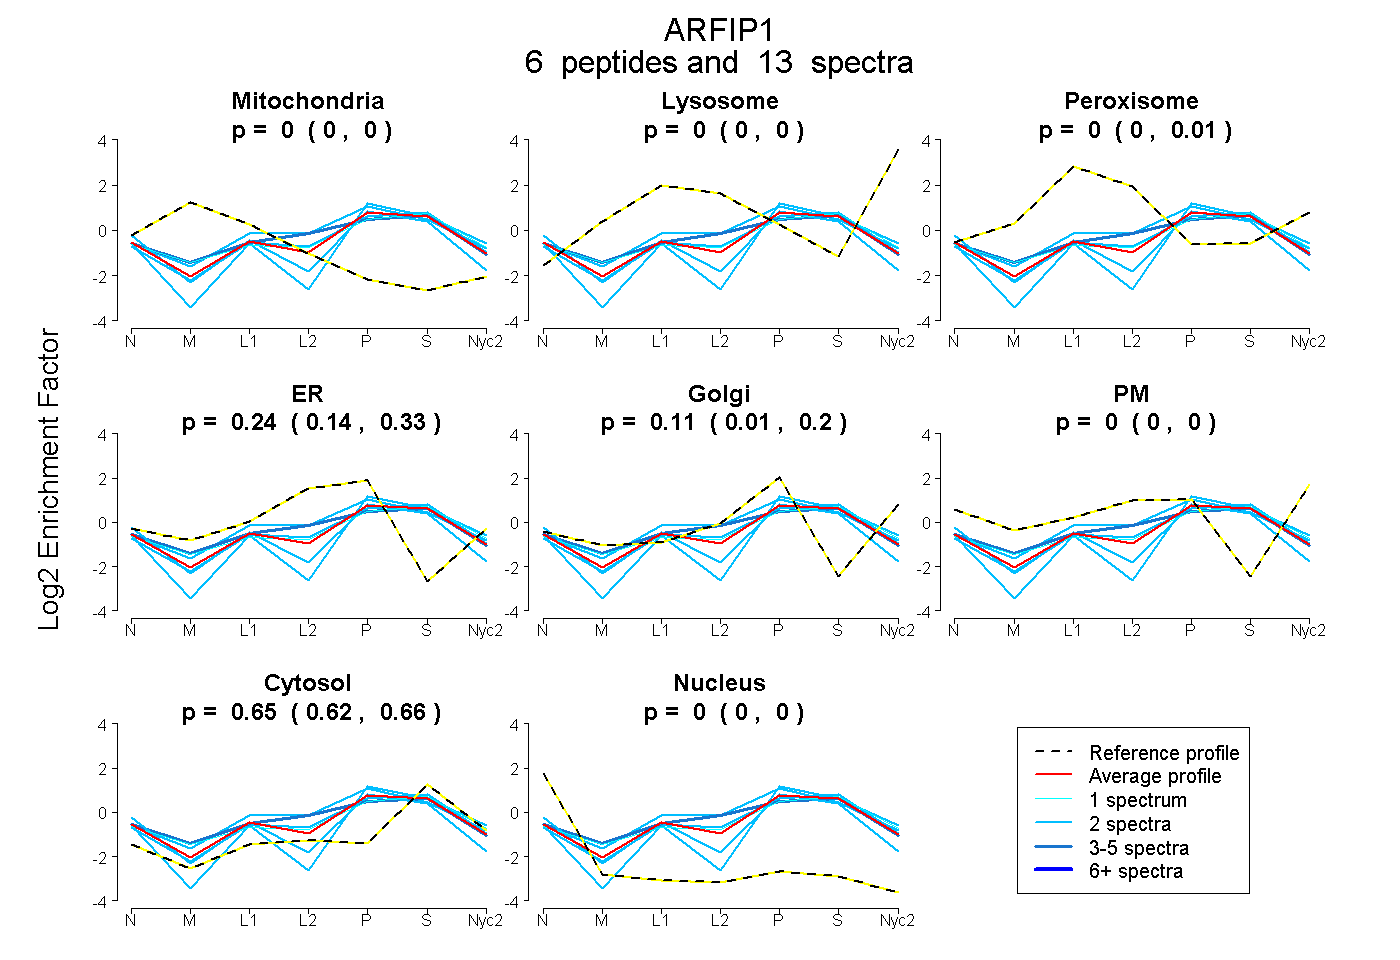
| Expt A |
6 peptides |
13 spectra |
|
0.000 0.000 | 0.000 |
0.000 0.000 | 0.000 |
0.000 0.000 | 0.005 |
0.240 0.141 | 0.325 |
0.114 0.013 | 0.202 |
0.000 0.000 | 0.000 |
0.646 0.623 | 0.663 |
0.000 0.000 | 0.000 |
| 2 spectra, LEYDAYR | 0.000 | 0.000 | 0.000 | 0.301 | 0.011 | 0.000 | 0.688 | 0.000 | ||
| 4 spectra, TDLEELNLGPR | 0.000 | 0.000 | 0.068 | 0.336 | 0.000 | 0.000 | 0.595 | 0.000 | ||
| 1 spectrum, WSLNTYK | 0.000 | 0.000 | 0.067 | 0.128 | 0.182 | 0.000 | 0.624 | 0.000 | ||
| 2 spectra, TIEDTLMTVK | 0.000 | 0.000 | 0.000 | 0.152 | 0.144 | 0.000 | 0.592 | 0.112 | ||
| 2 spectra, GGPVILADEIK | 0.000 | 0.000 | 0.000 | 0.000 | 0.294 | 0.000 | 0.684 | 0.022 | ||
| 2 spectra, DANTLPK | 0.000 | 0.000 | 0.062 | 0.412 | 0.000 | 0.000 | 0.526 | 0.000 |
| Plot | Mito | Lyso or Perox | ER | Golgi | PM | Cytosol | Nucleus | ||||||
| Expt B |
3 peptides |
3 spectra |
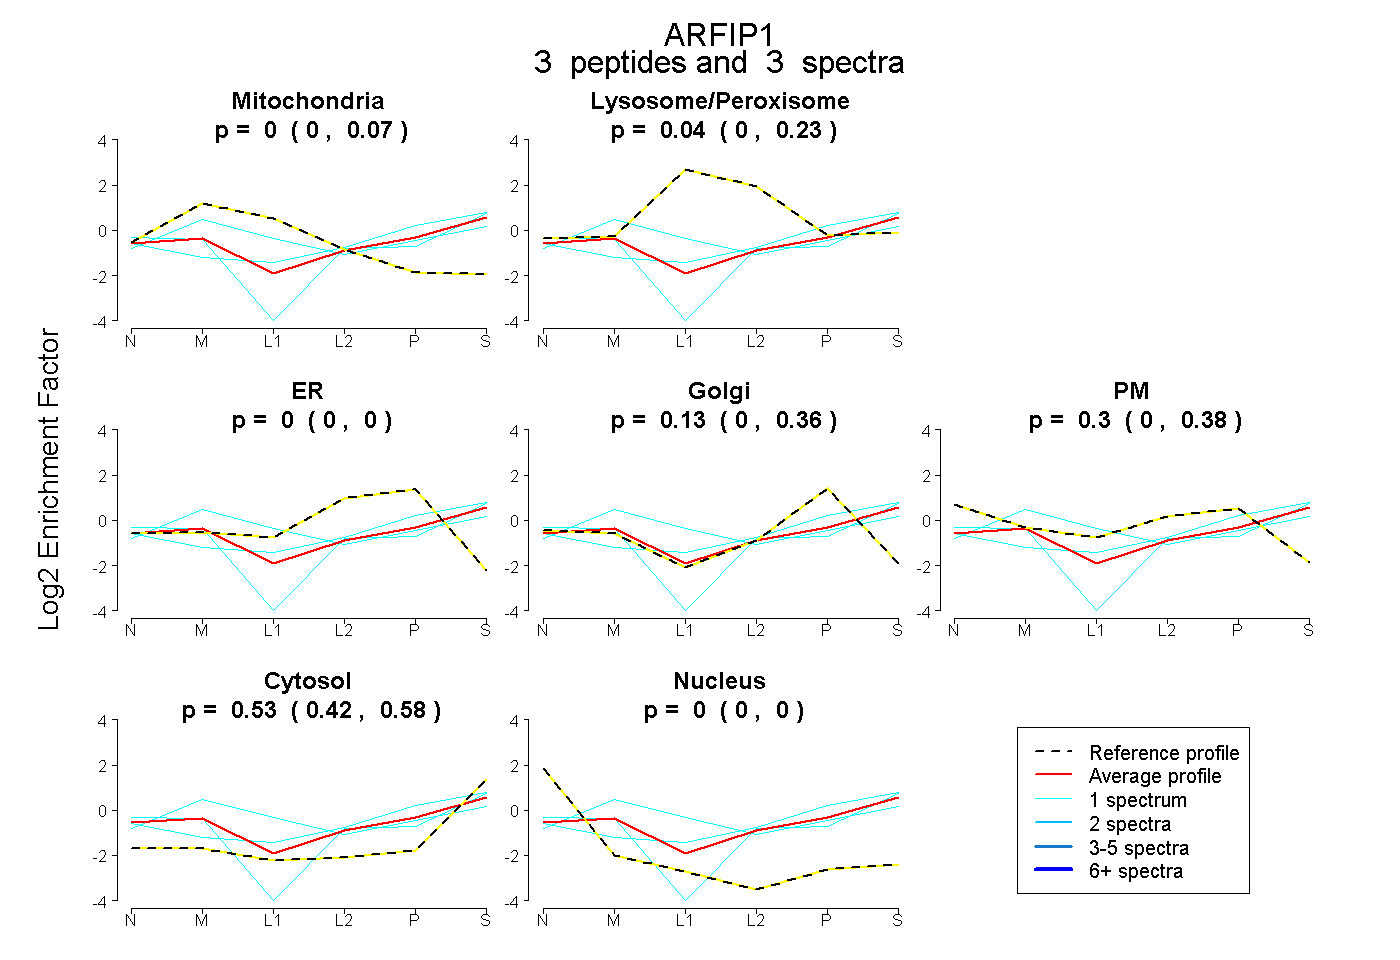 |
0.000 0.000 | 0.071 |
0.037 0.000 | 0.231 |
0.000 0.000 | 0.000 |
0.131 0.000 | 0.357 |
0.300 0.000 | 0.380 |
0.532 0.425 | 0.582 |
0.000 0.000 | 0.000 |
|||
| Plot | Lyso | Other | |||||||||||
| Expt C |
4 peptides |
21 spectra |
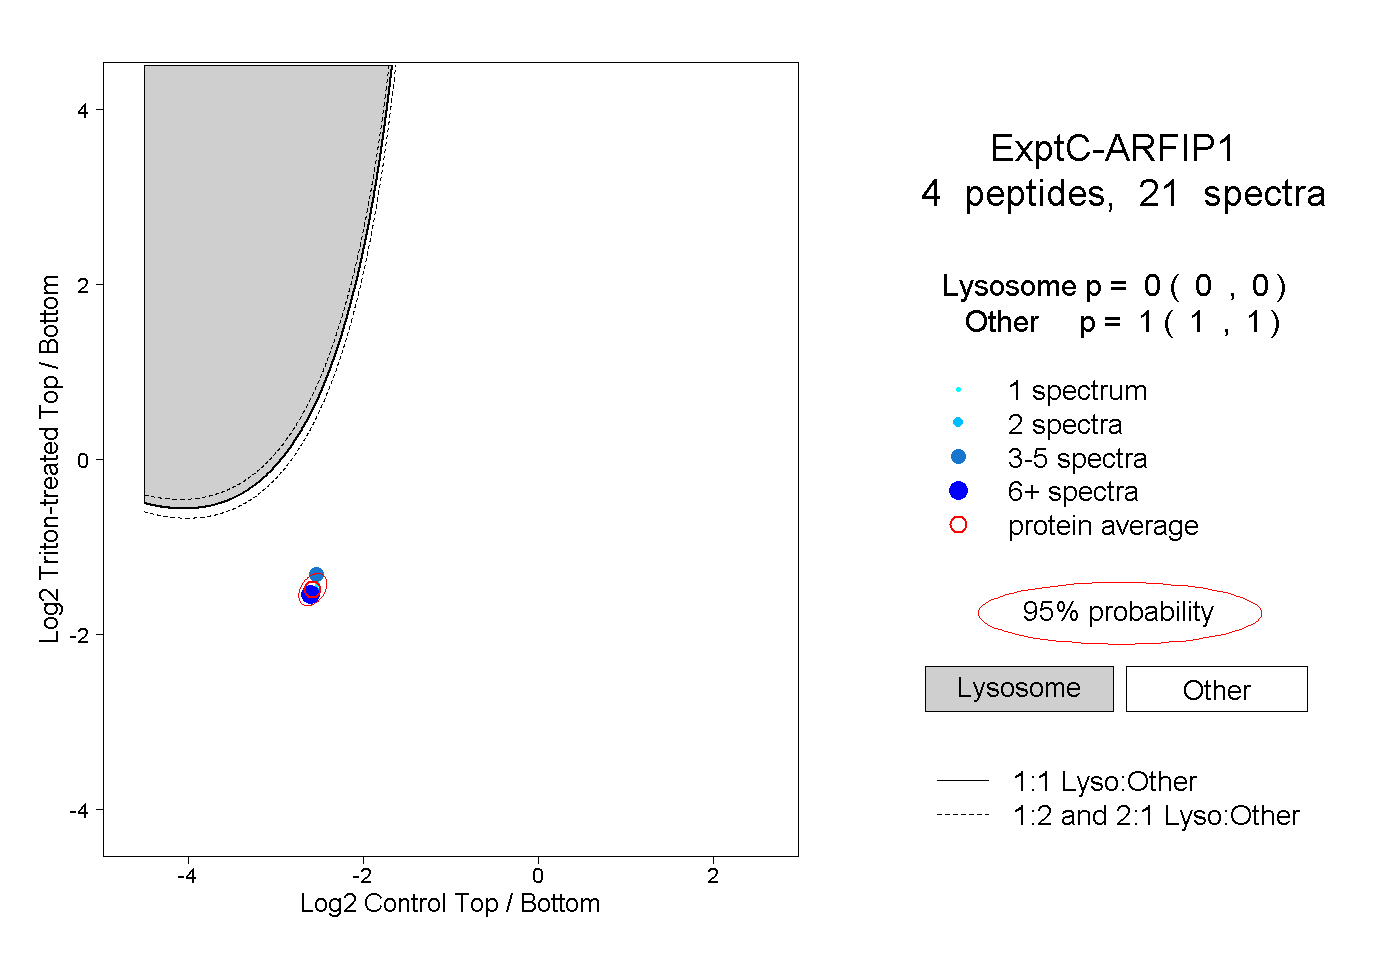 |
0.000 0.000 | 0.000 |
1.000 1.000 | 1.000 |