 34
34peptides
spectra
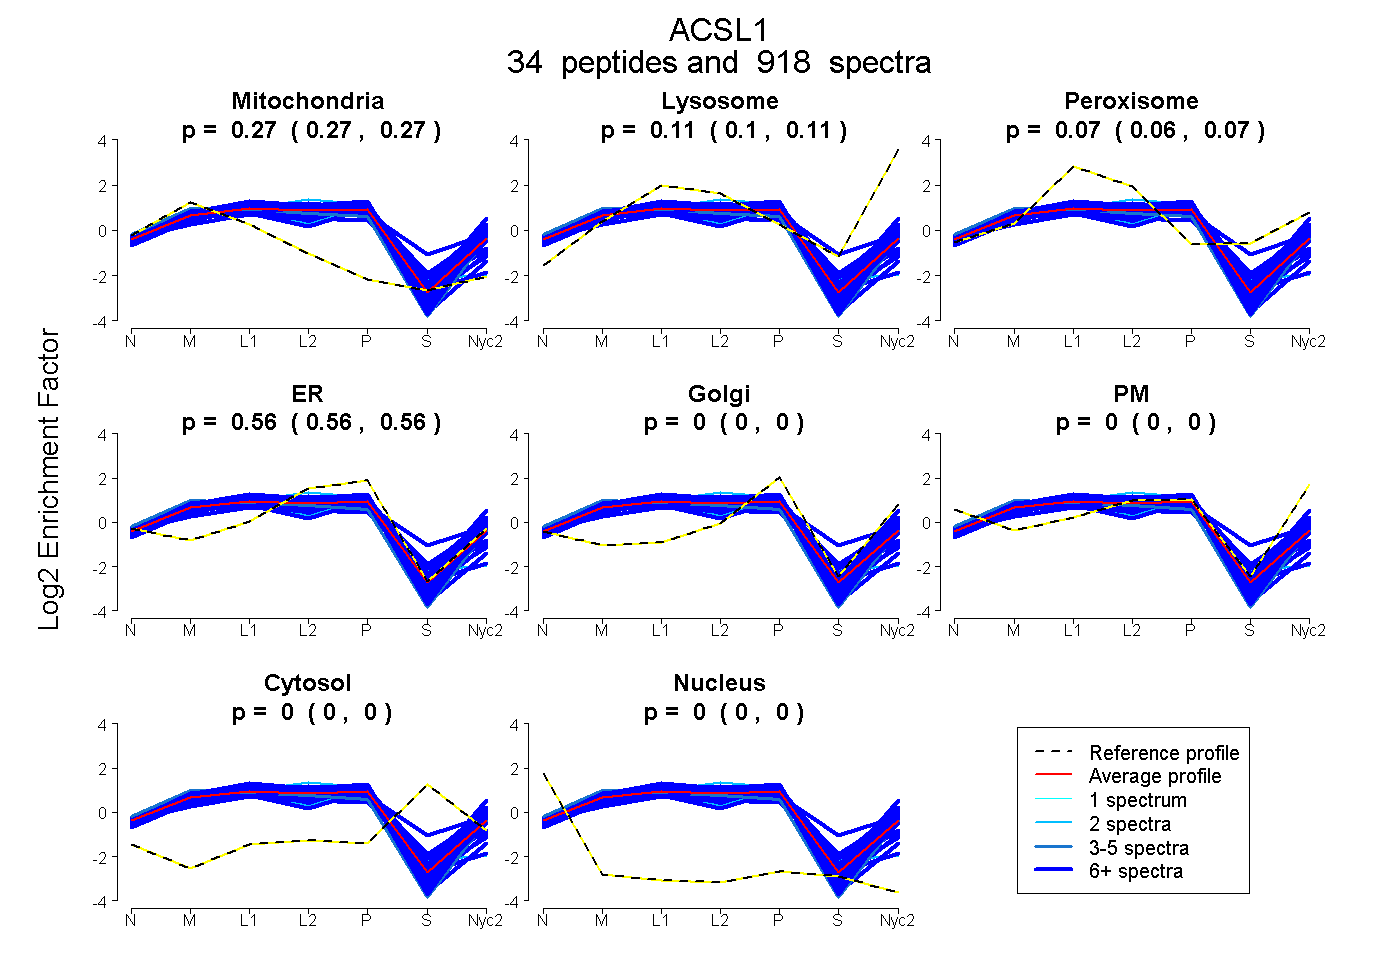
0.266 | 0.267
0.104 | 0.107
0.063 | 0.067
0.562 | 0.563
0.000 | 0.000
0.000 | 0.000
0.000 | 0.000
0.000 | 0.000
35peptides
spectra
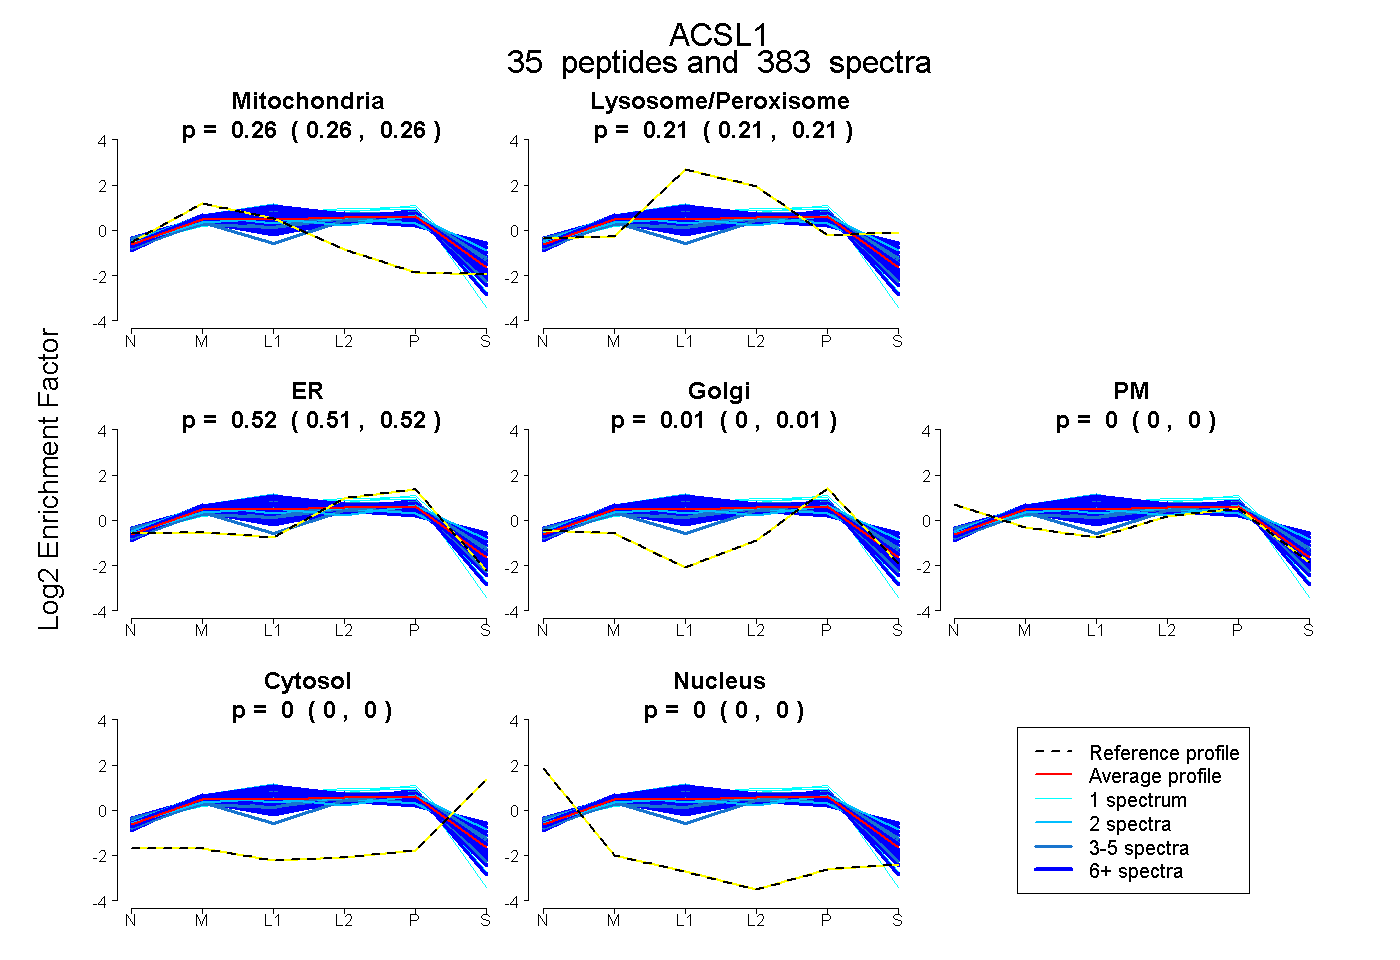
0.262 | 0.265
0.208 | 0.214
0.514 | 0.524
0.002 | 0.010
0.000 | 0.000
0.000 | 0.000
0.000 | 0.000
39peptides
spectra
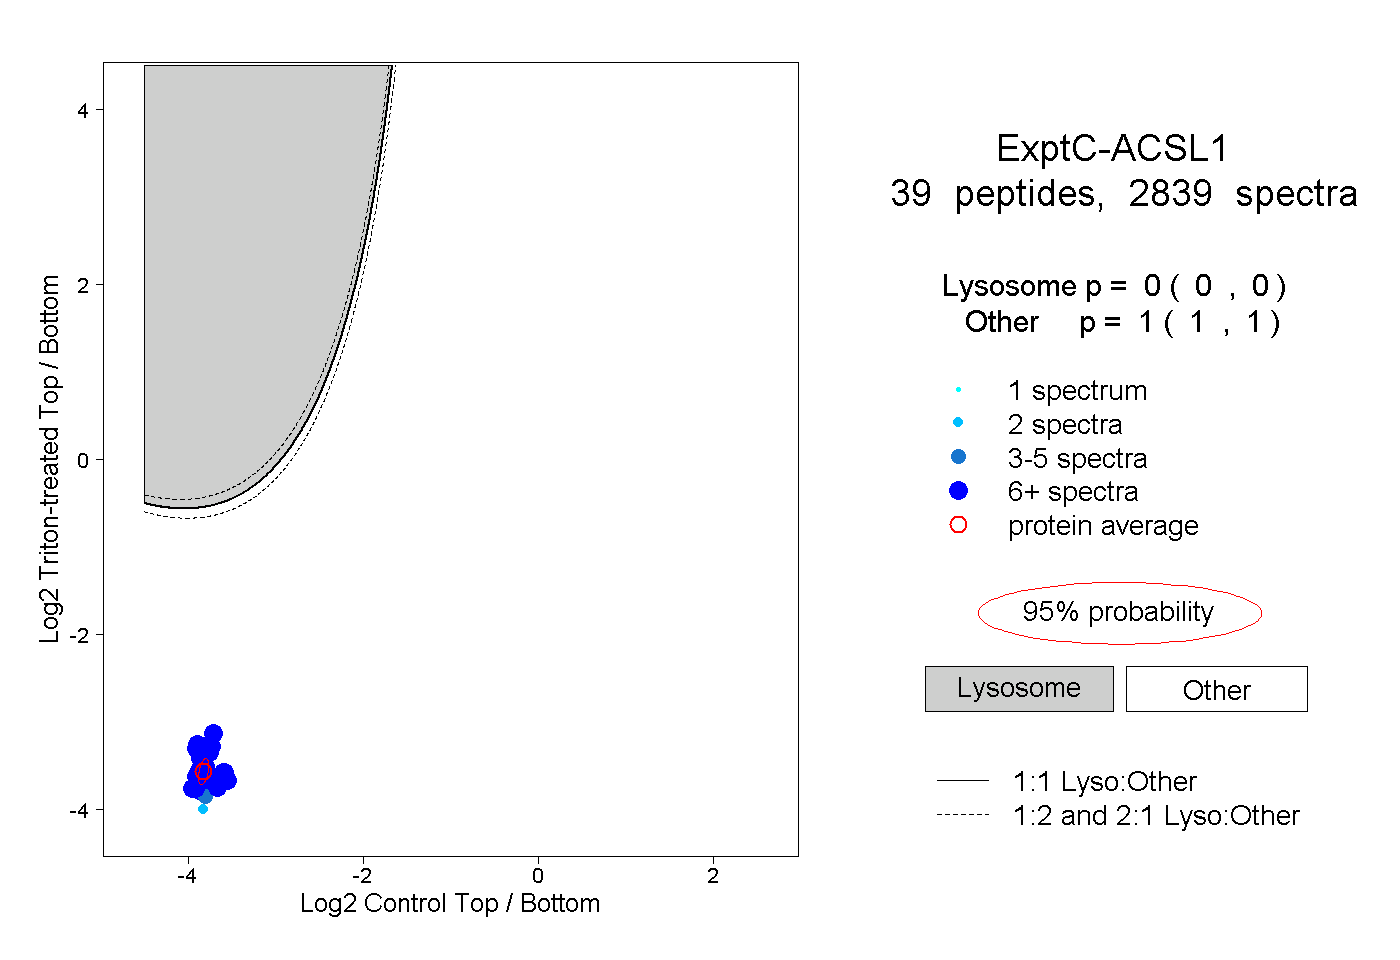
0.000 | 0.000
1.000 | 1.000
30peptides
spectra
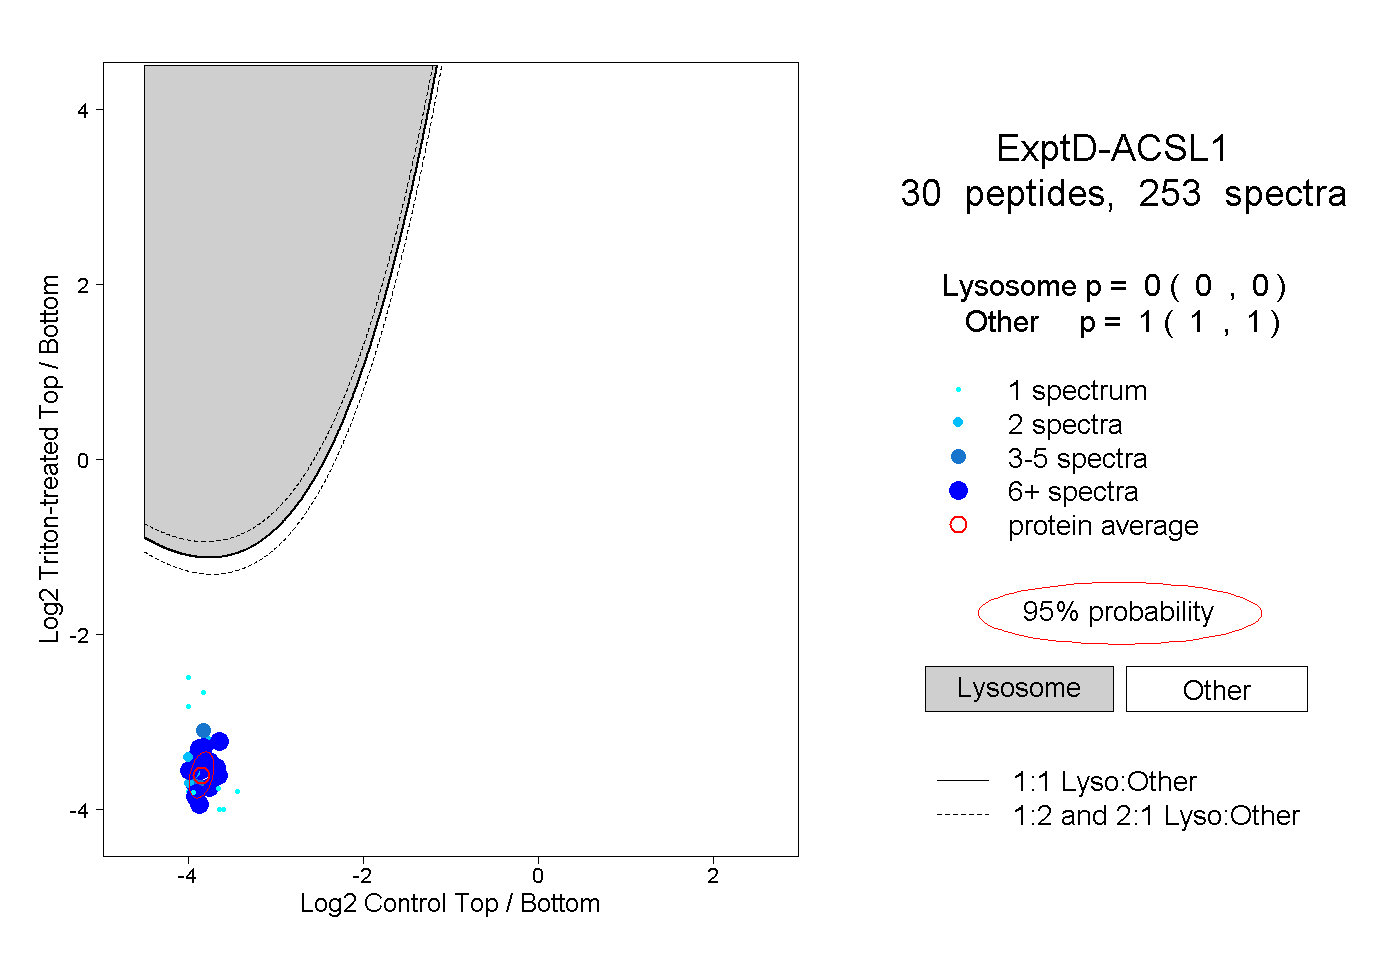
0.000 | 0.000
1.000 | 1.000