 5
5peptides
spectra
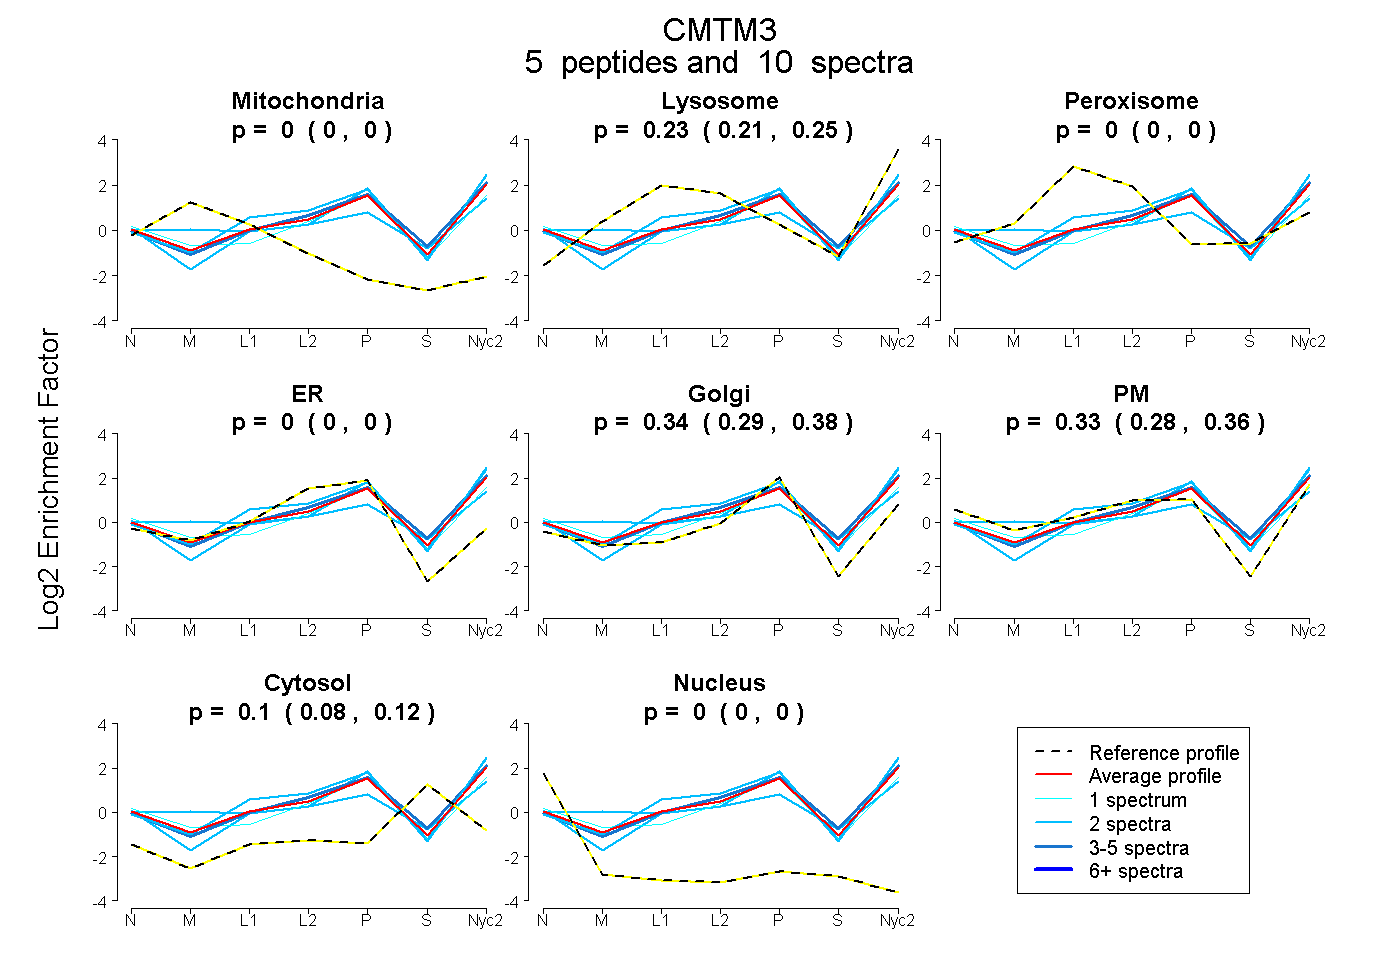
0.000 | 0.000
0.208 | 0.251
0.000 | 0.000
0.000 | 0.000
0.292 | 0.381
0.285 | 0.363
0.080 | 0.117
0.000 | 0.000
| Plot | Mito | Lyso | Perox | ER | Golgi | PM | Cytosol | Nucleus | |||||
| Expt A |
5 peptides |
10 spectra |
|
0.000 0.000 | 0.000 |
0.232 0.208 | 0.251 |
0.000 0.000 | 0.000 |
0.000 0.000 | 0.000 |
0.340 0.292 | 0.381 |
0.327 0.285 | 0.363 |
0.100 0.080 | 0.117 |
0.000 0.000 | 0.000 |
| 2 spectra, TVPGLR | 0.000 | 0.361 | 0.000 | 0.000 | 0.384 | 0.255 | 0.000 | 0.000 | ||
| 2 spectra, AFLCSLK | 0.014 | 0.188 | 0.000 | 0.000 | 0.080 | 0.507 | 0.210 | 0.000 | ||
| 2 spectra, ALLPAR | 0.000 | 0.217 | 0.000 | 0.000 | 0.528 | 0.191 | 0.064 | 0.000 | ||
| 3 spectra, QGDSGNETTAHR | 0.000 | 0.276 | 0.000 | 0.000 | 0.337 | 0.261 | 0.125 | 0.000 | ||
| 1 spectrum, DAEPEPDPESTHGPR | 0.000 | 0.081 | 0.000 | 0.000 | 0.388 | 0.421 | 0.111 | 0.000 |
| Plot | Lyso | Other | |||||||||||
| Expt C |
2 peptides |
3 spectra |
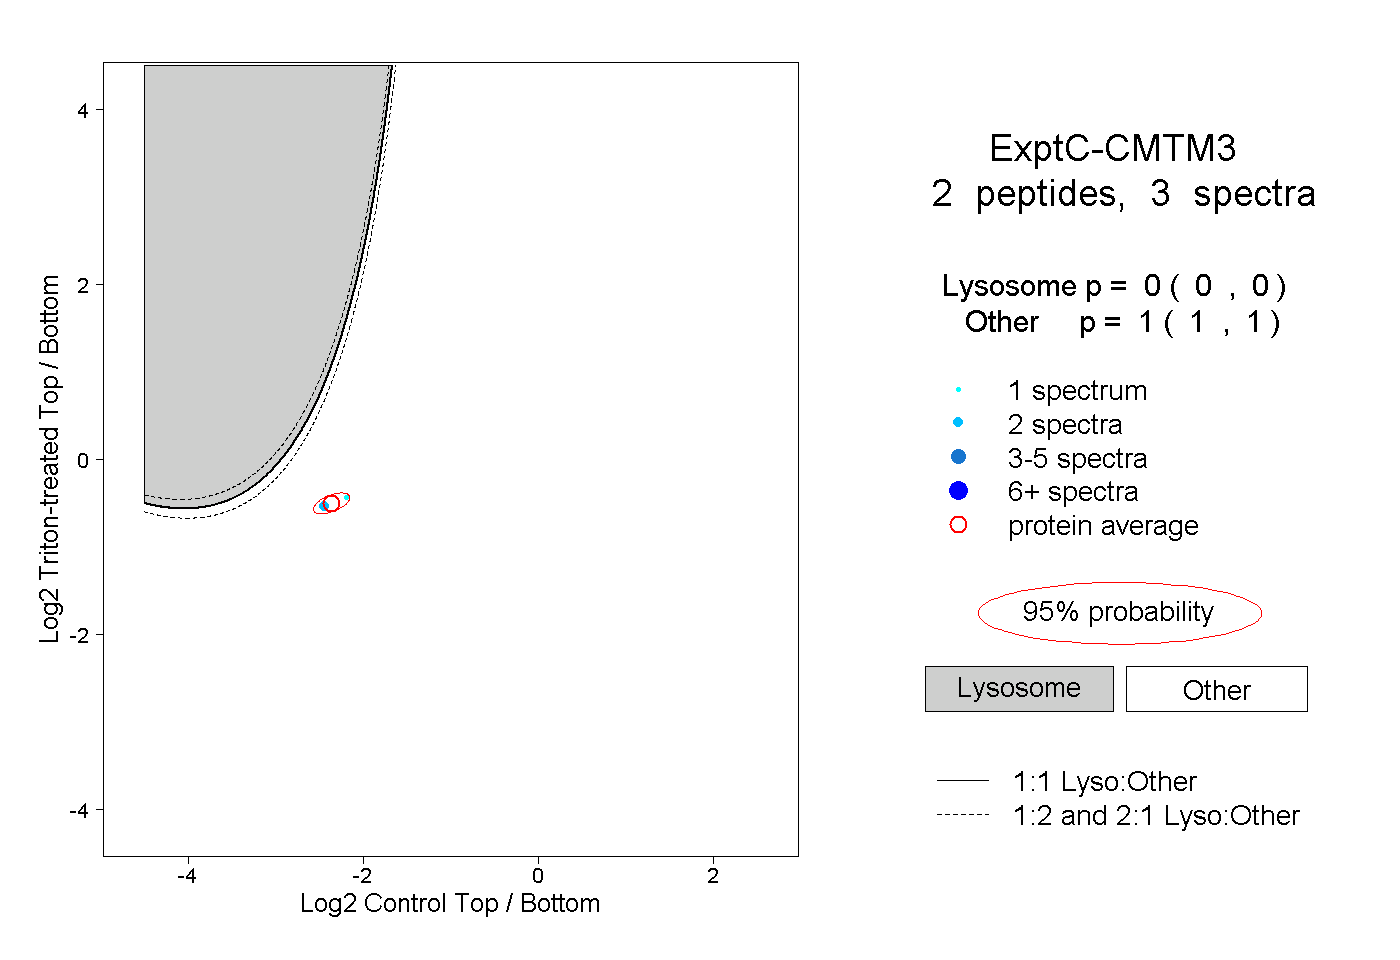 |
0.000 0.000 | 0.000 |
1.000 1.000 | 1.000 |