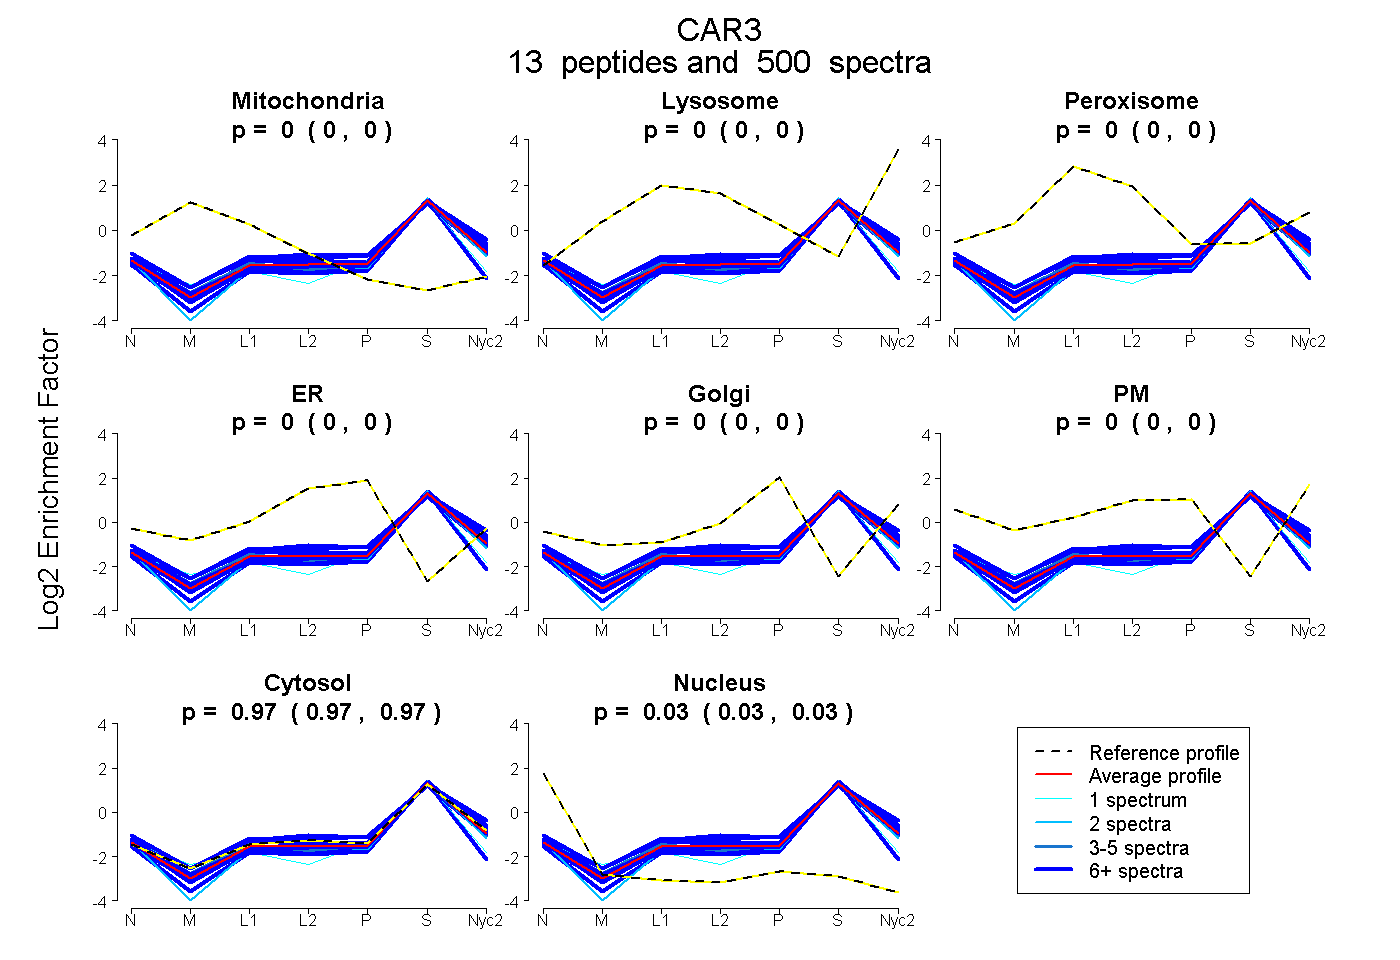
 13
13peptides
spectra
0.000 | 0.000
0.000 | 0.000
0.000 | 0.000
0.000 | 0.000
0.000 | 0.000
0.000 | 0.000
0.968 | 0.969
0.030 | 0.032
| Plot | Mito | Lyso | Perox | ER | Golgi | PM | Cytosol | Nucleus | |||||
| Expt A |
13 peptides |
500 spectra |
|
0.000 0.000 | 0.000 |
0.000 0.000 | 0.000 |
0.000 0.000 | 0.000 |
0.000 0.000 | 0.000 |
0.000 0.000 | 0.000 |
0.000 0.000 | 0.000 |
0.969 0.968 | 0.969 |
0.031 0.030 | 0.032 |
| 41 spectra, EPMTVSSDQMAK | 0.000 | 0.016 | 0.012 | 0.000 | 0.027 | 0.010 | 0.935 | 0.000 | ||
| 18 spectra, GEFQILLDALDK | 0.000 | 0.000 | 0.000 | 0.000 | 0.000 | 0.000 | 0.983 | 0.017 | ||
| 22 spectra, GDNQSPIELHTK | 0.000 | 0.000 | 0.018 | 0.041 | 0.000 | 0.000 | 0.919 | 0.022 | ||
| 98 spectra, GGPLSGPYR | 0.000 | 0.000 | 0.000 | 0.000 | 0.000 | 0.000 | 0.962 | 0.038 | ||
| 25 spectra, YNTFGEALK | 0.000 | 0.000 | 0.000 | 0.000 | 0.000 | 0.000 | 1.000 | 0.000 | ||
| 201 spectra, VVFDDTFDR | 0.000 | 0.000 | 0.000 | 0.000 | 0.000 | 0.000 | 0.962 | 0.038 | ||
| 21 spectra, QPDGIAVVGIFLK | 0.000 | 0.000 | 0.000 | 0.000 | 0.000 | 0.000 | 0.958 | 0.042 | ||
| 27 spectra, EAPFNHFDPSCLFPACR | 0.000 | 0.000 | 0.000 | 0.000 | 0.000 | 0.000 | 0.925 | 0.075 | ||
| 20 spectra, YAAELHLVHWNPK | 0.000 | 0.000 | 0.000 | 0.000 | 0.000 | 0.000 | 0.976 | 0.024 | ||
| 1 spectrum, EWGYASHNGPEHWHELYPIAK | 0.000 | 0.000 | 0.000 | 0.000 | 0.000 | 0.000 | 0.877 | 0.123 | ||
| 3 spectra, HDPSLQPWSVSYDPGSAK | 0.000 | 0.000 | 0.000 | 0.000 | 0.000 | 0.000 | 0.949 | 0.051 | ||
| 21 spectra, TILNNGK | 0.000 | 0.000 | 0.000 | 0.000 | 0.000 | 0.000 | 0.996 | 0.004 | ||
| 2 spectra, SLFASAENEPPVPLVGNWRPPQPIK | 0.000 | 0.000 | 0.000 | 0.000 | 0.000 | 0.000 | 0.946 | 0.054 |
| Plot | Mito | Lyso or Perox | ER | Golgi | PM | Cytosol | Nucleus | ||||||
| Expt B |
12 peptides |
343 spectra |
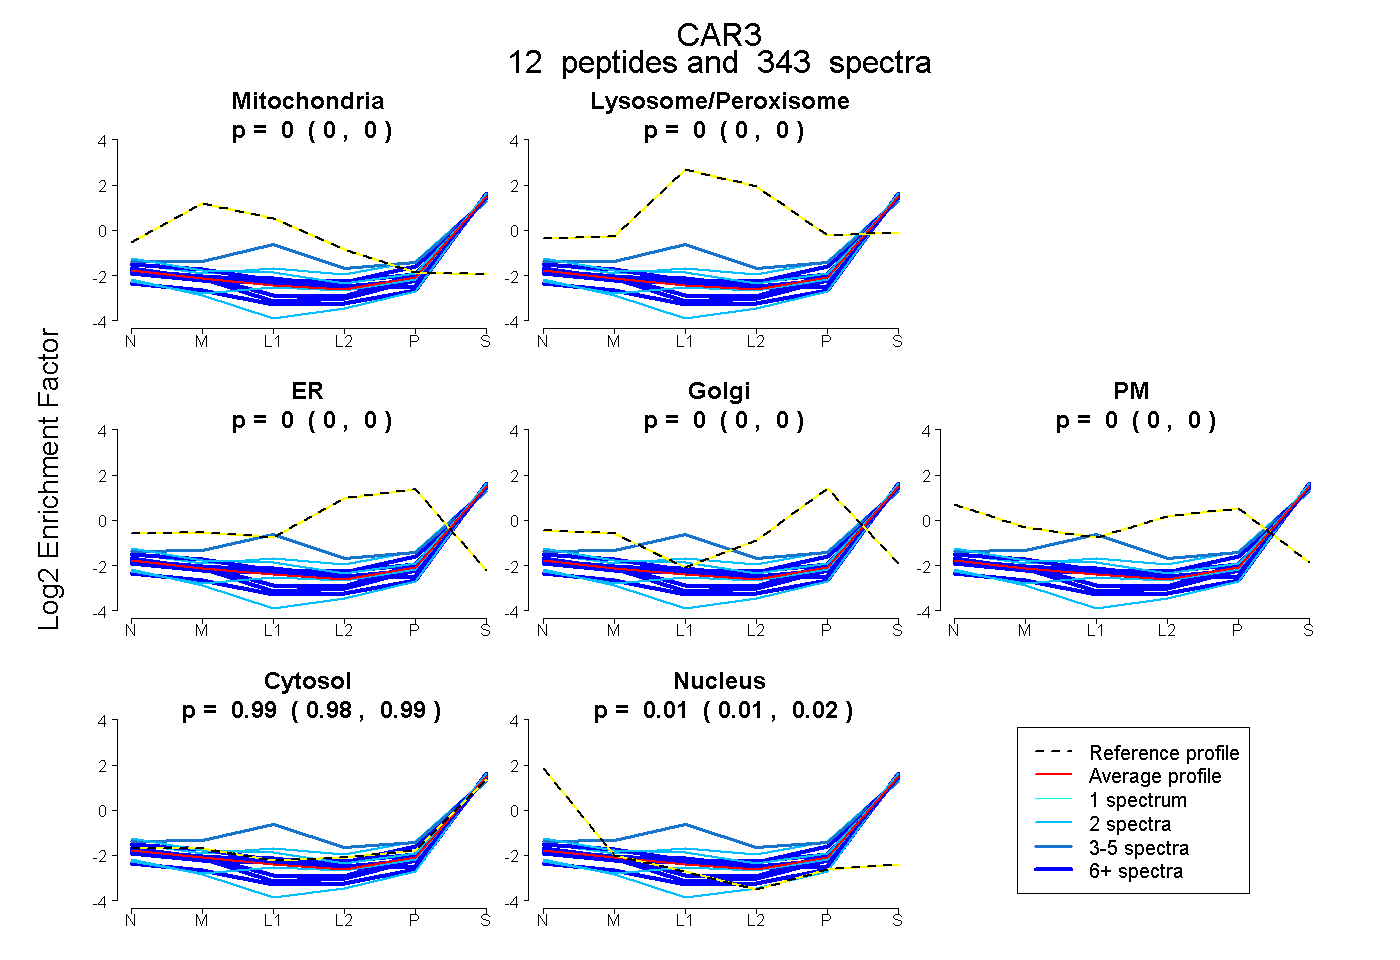 |
0.000 0.000 | 0.000 |
0.000 0.000 | 0.000 |
0.000 0.000 | 0.000 |
0.000 0.000 | 0.000 |
0.000 0.000 | 0.000 |
0.986 0.984 | 0.987 |
0.014 0.013 | 0.016 |
|||
| Plot | Lyso | Other | |||||||||||
| Expt C |
11 peptides |
508 spectra |
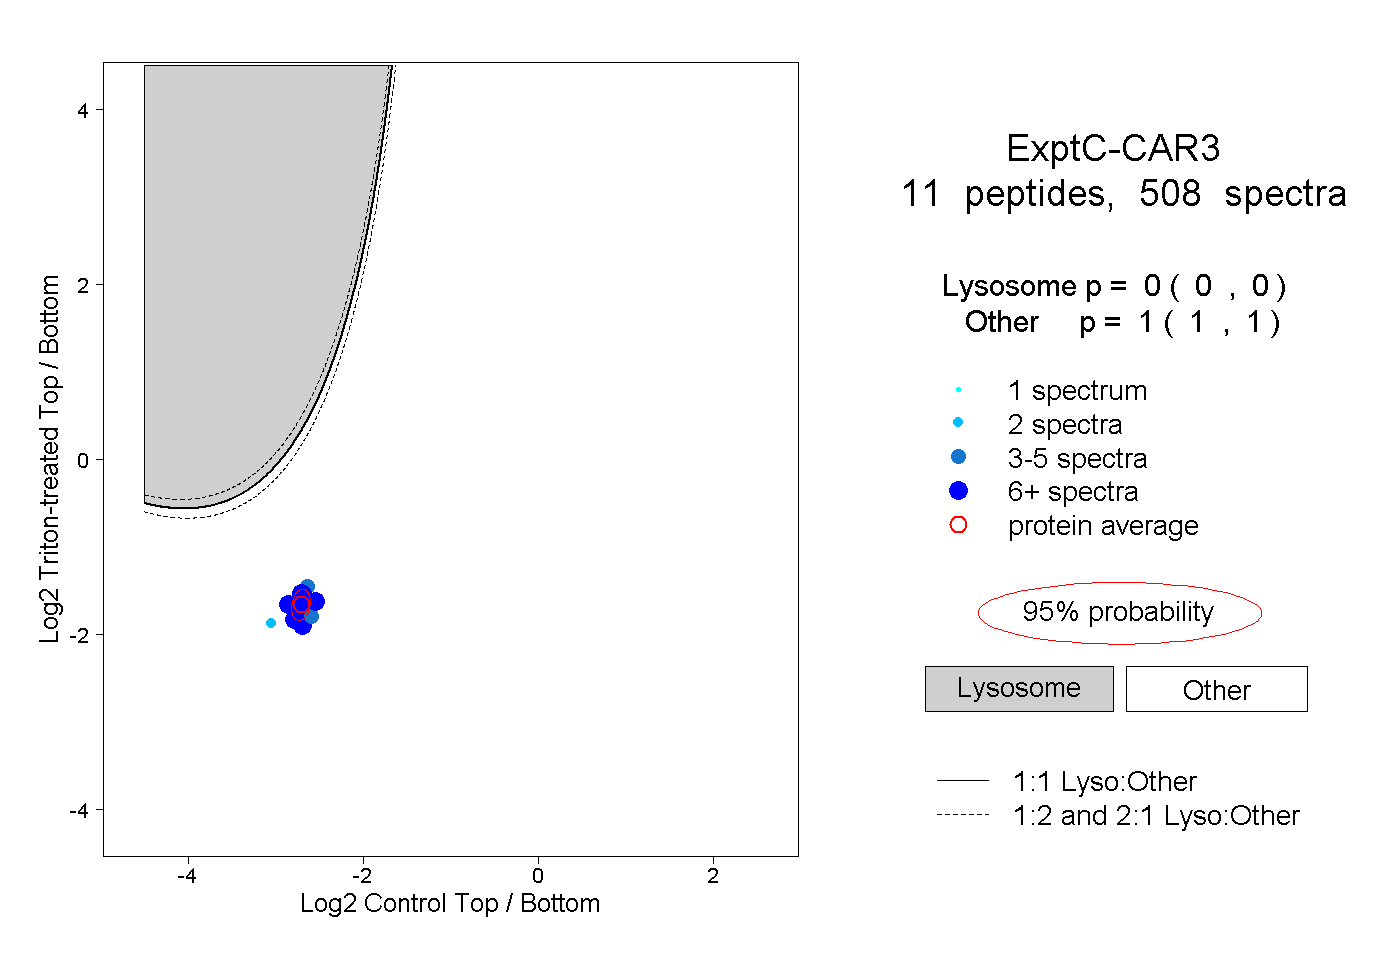 |
0.000 0.000 | 0.000 |
1.000 1.000 | 1.000 |
||||||||
| Plot | Lyso | Other | |||||||||||
| Expt D |
7 peptides |
54 spectra |
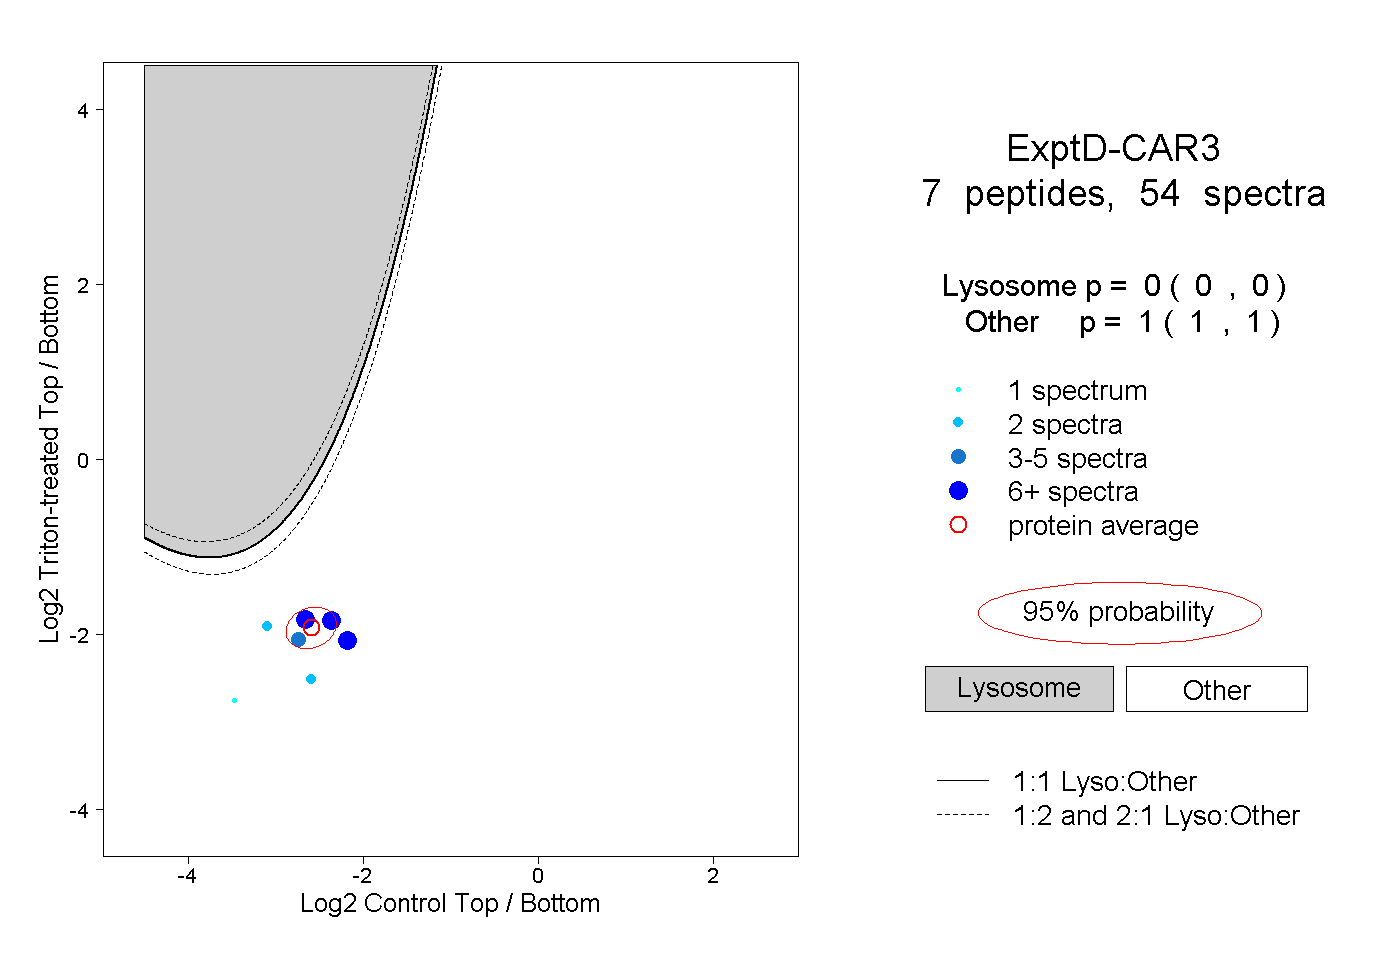 |
0.000 0.000 | 0.000 |
1.000 1.000 | 1.000 |