 4
4peptides
spectra
0.000 | 0.000
0.000 | 0.112
0.000 | 0.041
0.067 | 0.293
0.000 | 0.098
0.000 | 0.000
0.658 | 0.733
0.000 | 0.000
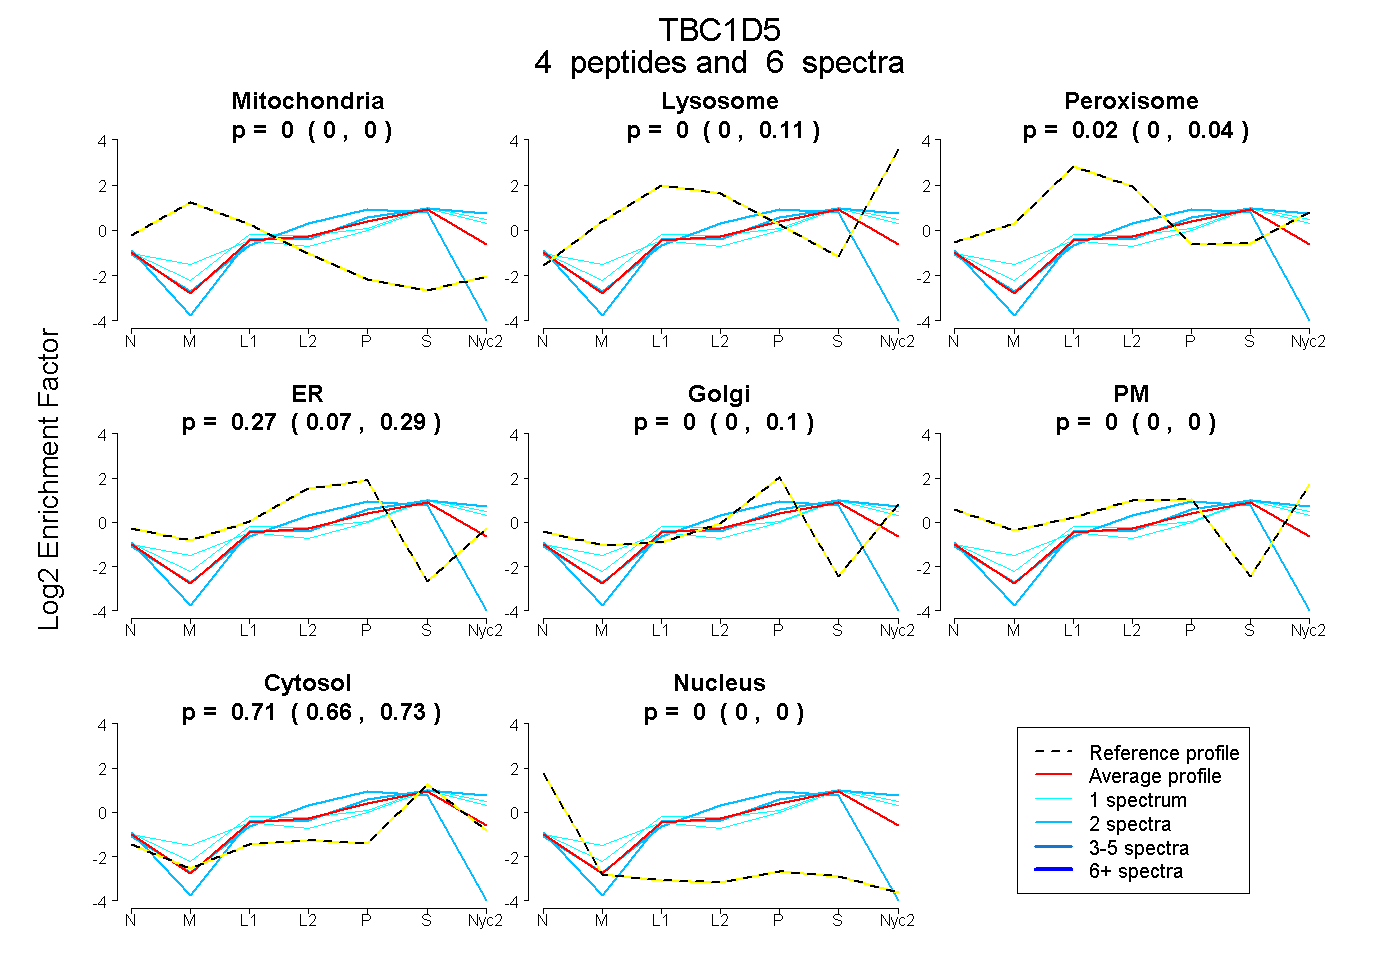
| Plot | Mito | Lyso | Perox | ER | Golgi | PM | Cytosol | Nucleus | |||||
| Expt A |
4 peptides |
6 spectra |
|
0.000 0.000 | 0.000 |
0.000 0.000 | 0.112 |
0.023 0.000 | 0.041 |
0.269 0.067 | 0.293 |
0.000 0.000 | 0.098 |
0.000 0.000 | 0.000 |
0.708 0.658 | 0.733 |
0.000 0.000 | 0.000 |
| 2 spectra, VSNSLINFGR | 0.000 | 0.117 | 0.000 | 0.000 | 0.212 | 0.000 | 0.671 | 0.000 | ||
| 1 spectrum, SWYSNIK | 0.000 | 0.185 | 0.031 | 0.000 | 0.132 | 0.000 | 0.651 | 0.000 | ||
| 2 spectra, LFLCVLPQDK | 0.000 | 0.000 | 0.000 | 0.319 | 0.000 | 0.000 | 0.613 | 0.067 | ||
| 1 spectrum, ENEQLLYK | 0.000 | 0.209 | 0.048 | 0.000 | 0.097 | 0.000 | 0.646 | 0.000 |
| Plot | Mito | Lyso or Perox | ER | Golgi | PM | Cytosol | Nucleus | ||||||
| Expt B |
1 peptide |
1 spectrum |
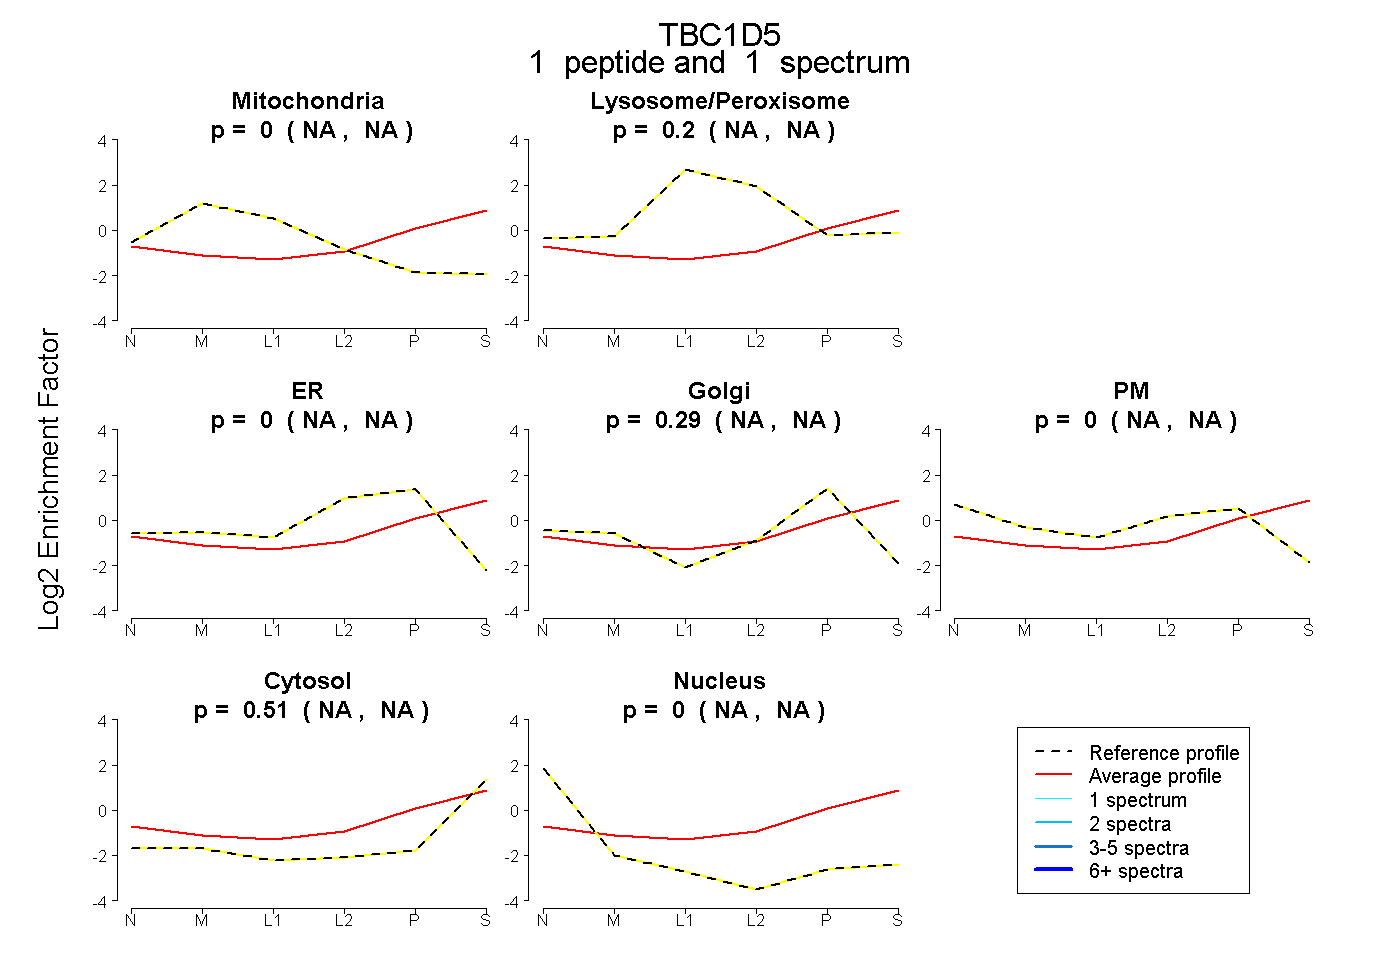 |
0.000 NA | NA |
0.198 NA | NA |
0.000 NA | NA |
0.289 NA | NA |
0.000 NA | NA |
0.513 NA | NA |
0.000 NA | NA |
|||
| Plot | Lyso | Other | |||||||||||
| Expt C |
1 peptide |
2 spectra |
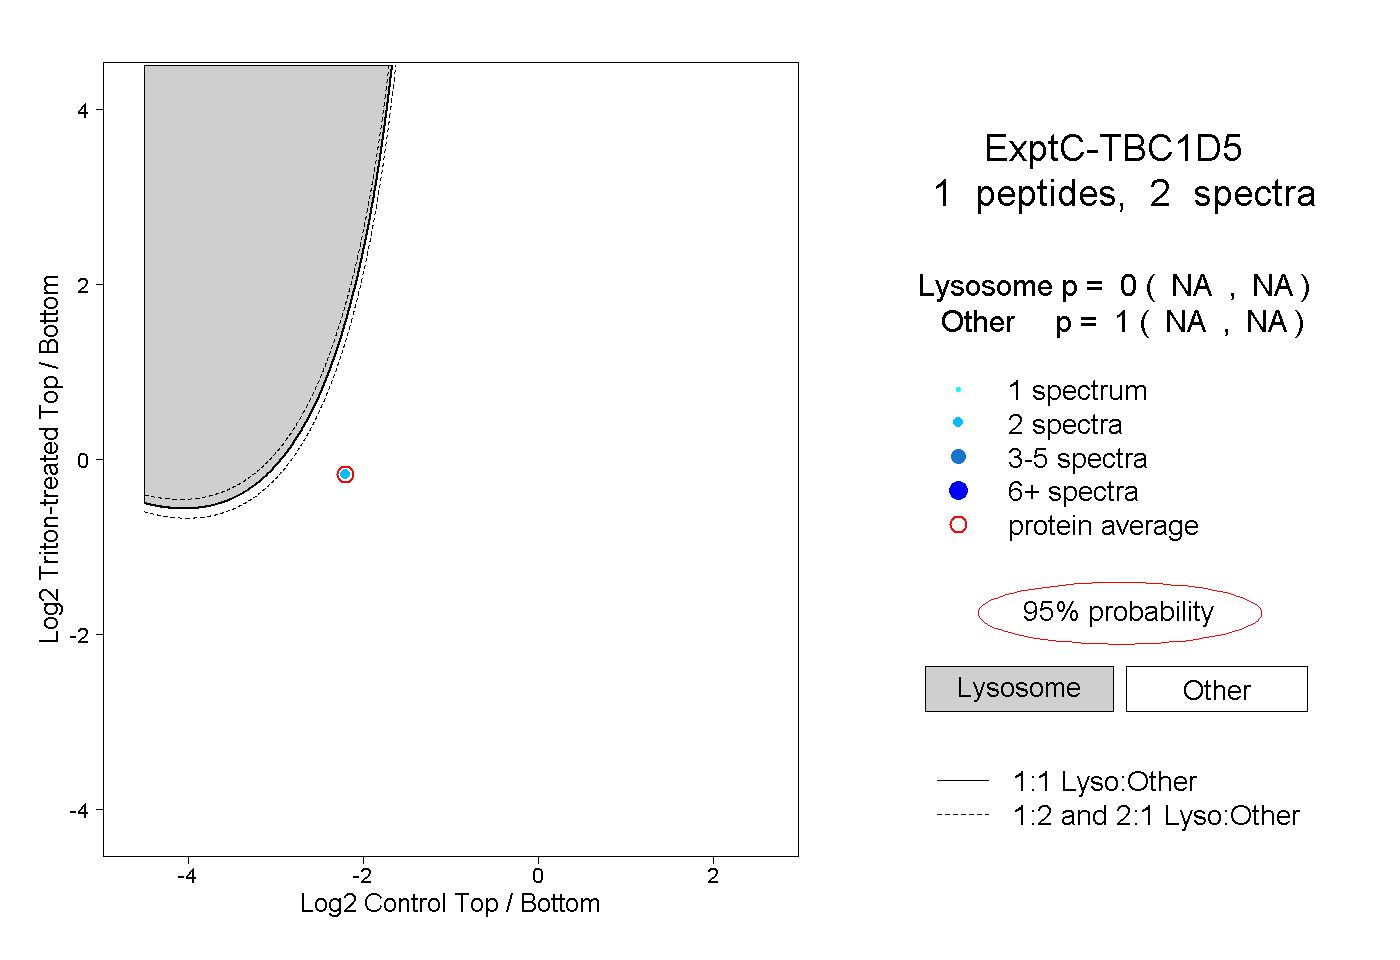 |
0.000 NA | NA |
1.000 NA | NA |