 7
7peptides
spectra
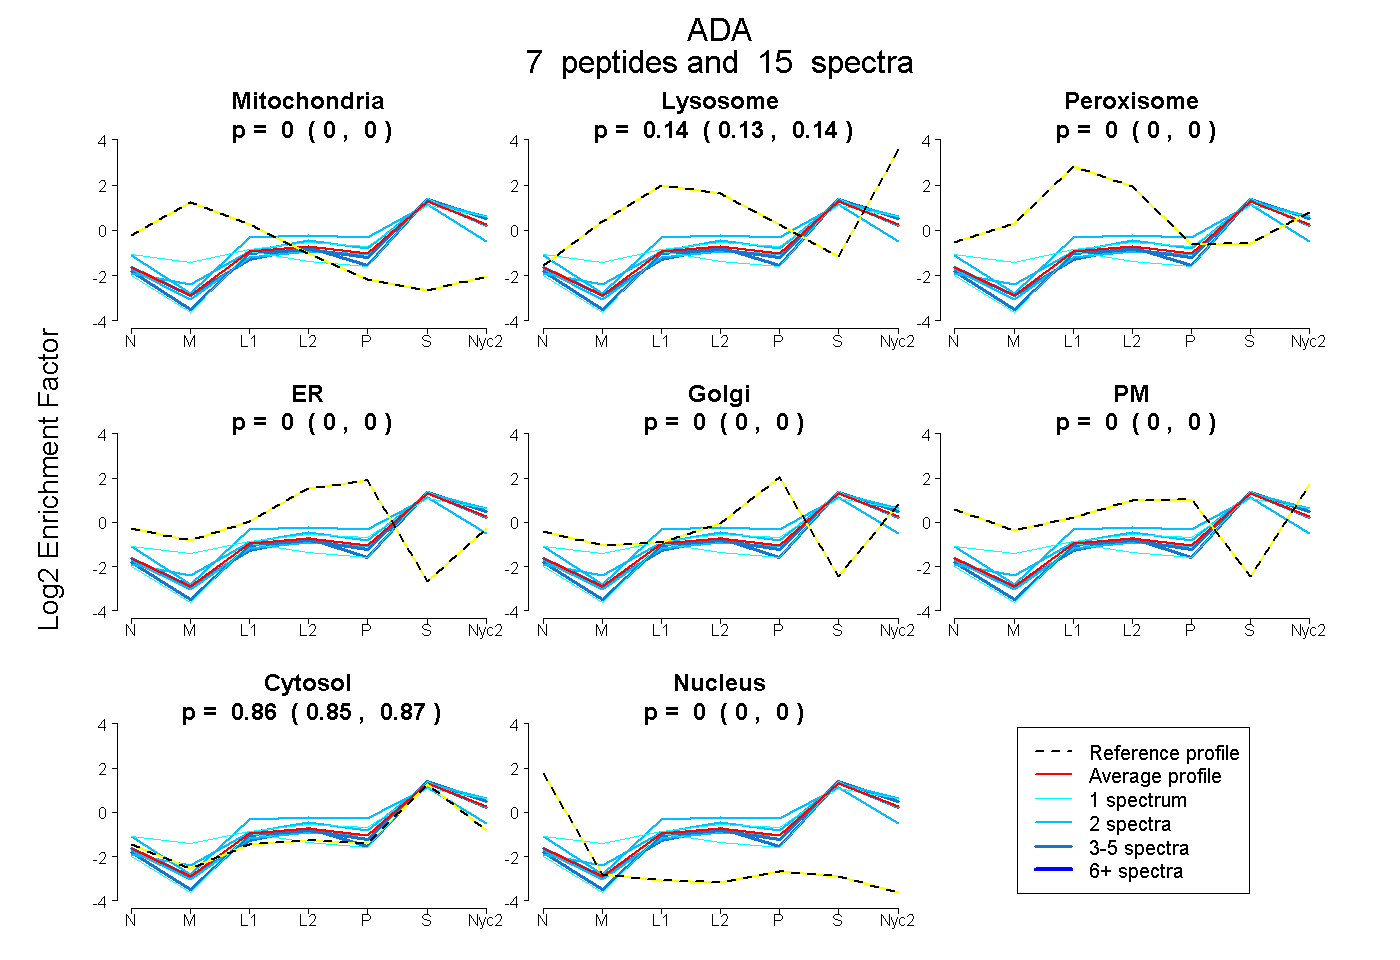
0.000 | 0.000
0.126 | 0.144
0.000 | 0.000
0.000 | 0.000
0.000 | 0.000
0.000 | 0.000
0.854 | 0.872
0.000 | 0.000
1peptide
spectrum
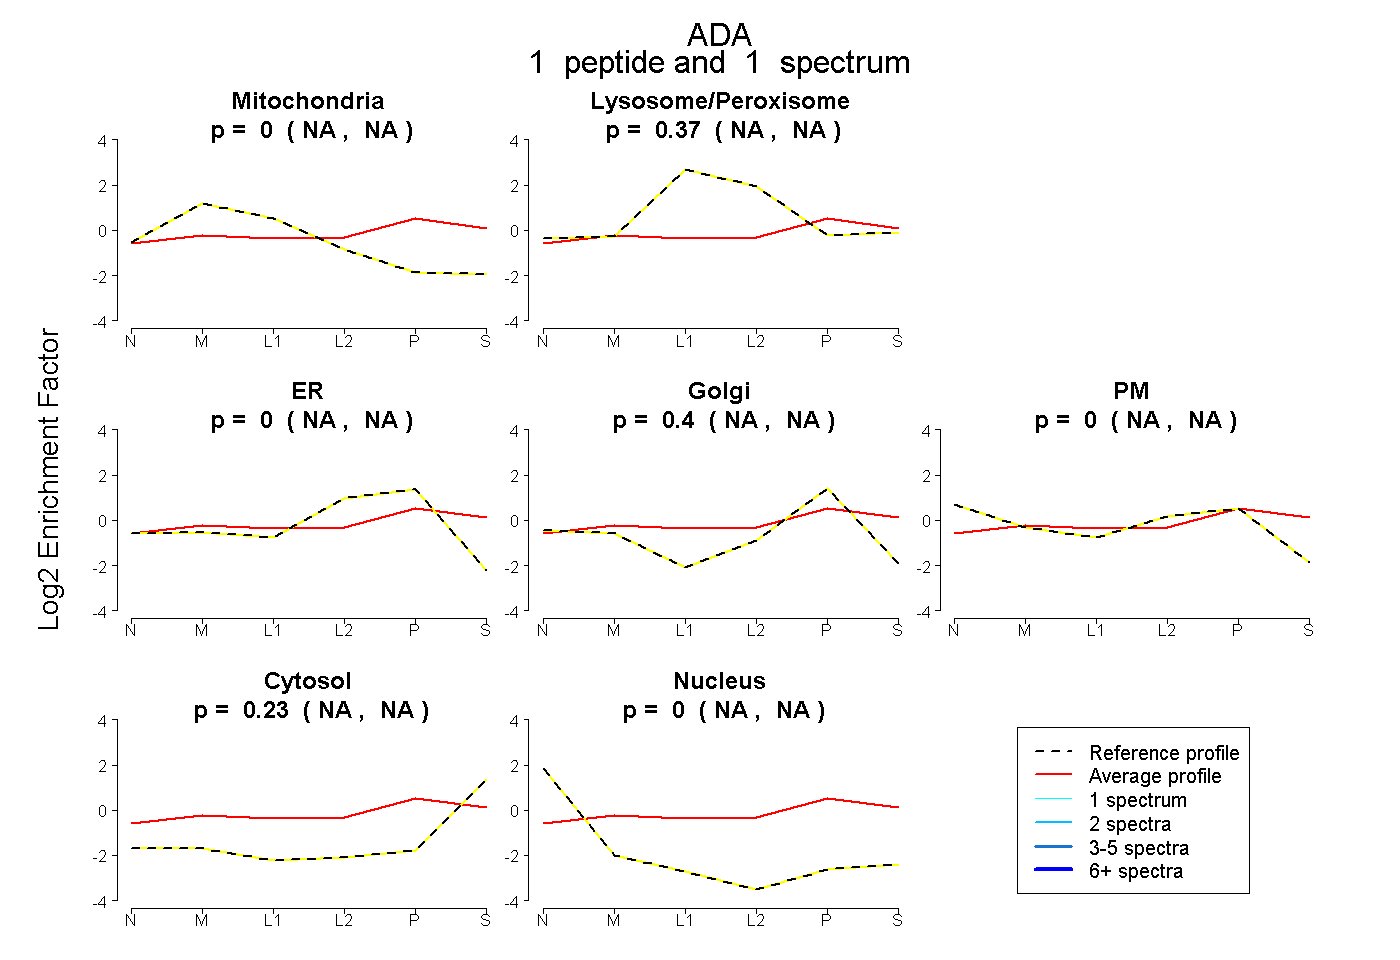
NA | NA
NA | NA
NA | NA
NA | NA
NA | NA
NA | NA
NA | NA
6peptides
spectra
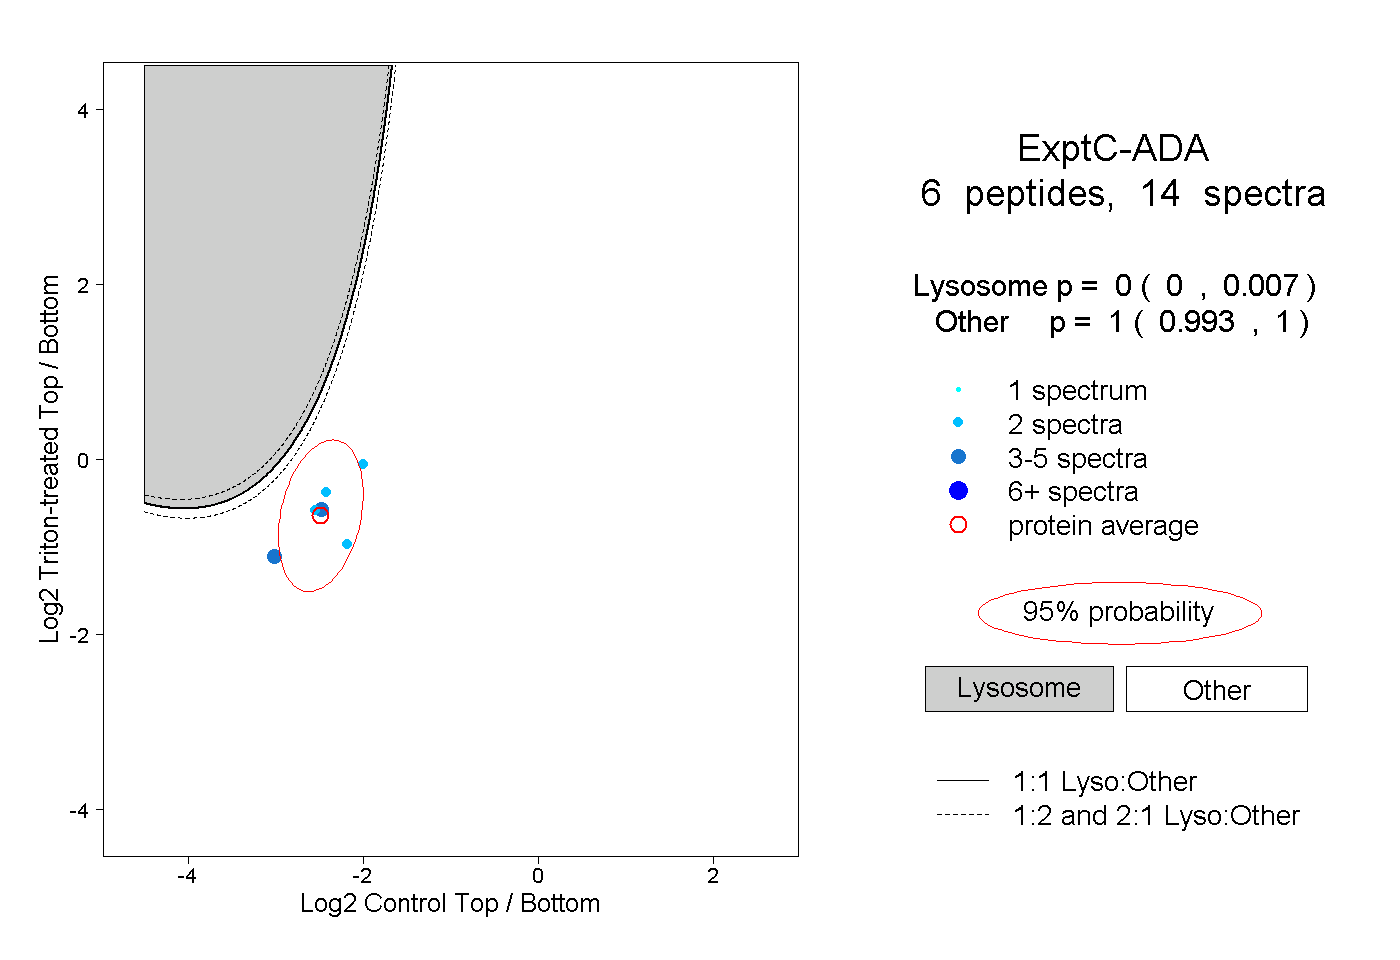
0.000 | 0.007
0.993 | 1.000
1peptide
spectrum
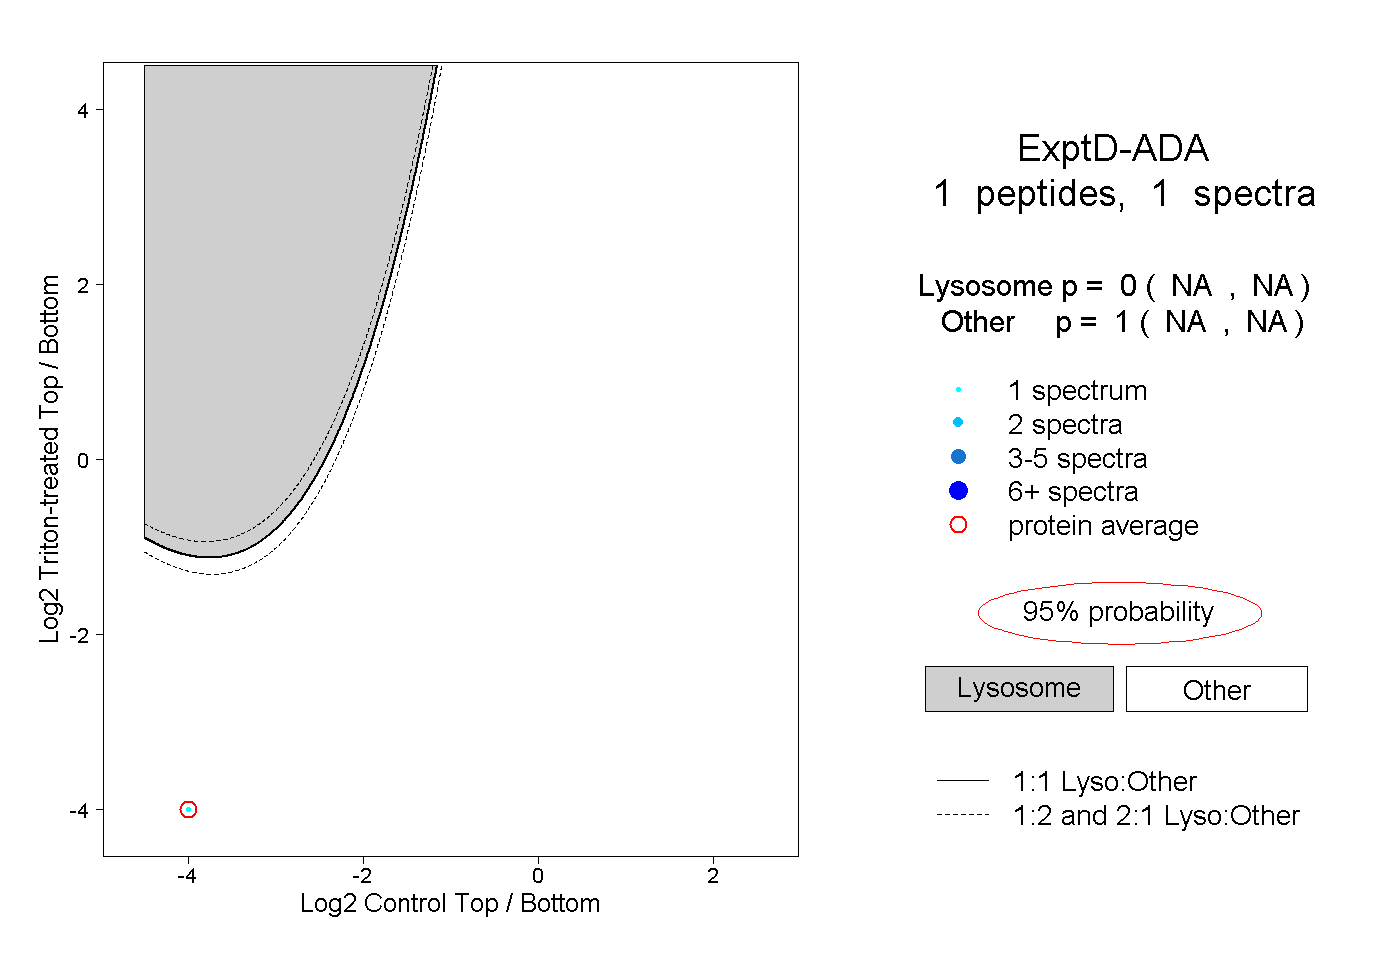
NA | NA
NA | NA