11
11peptides
spectra
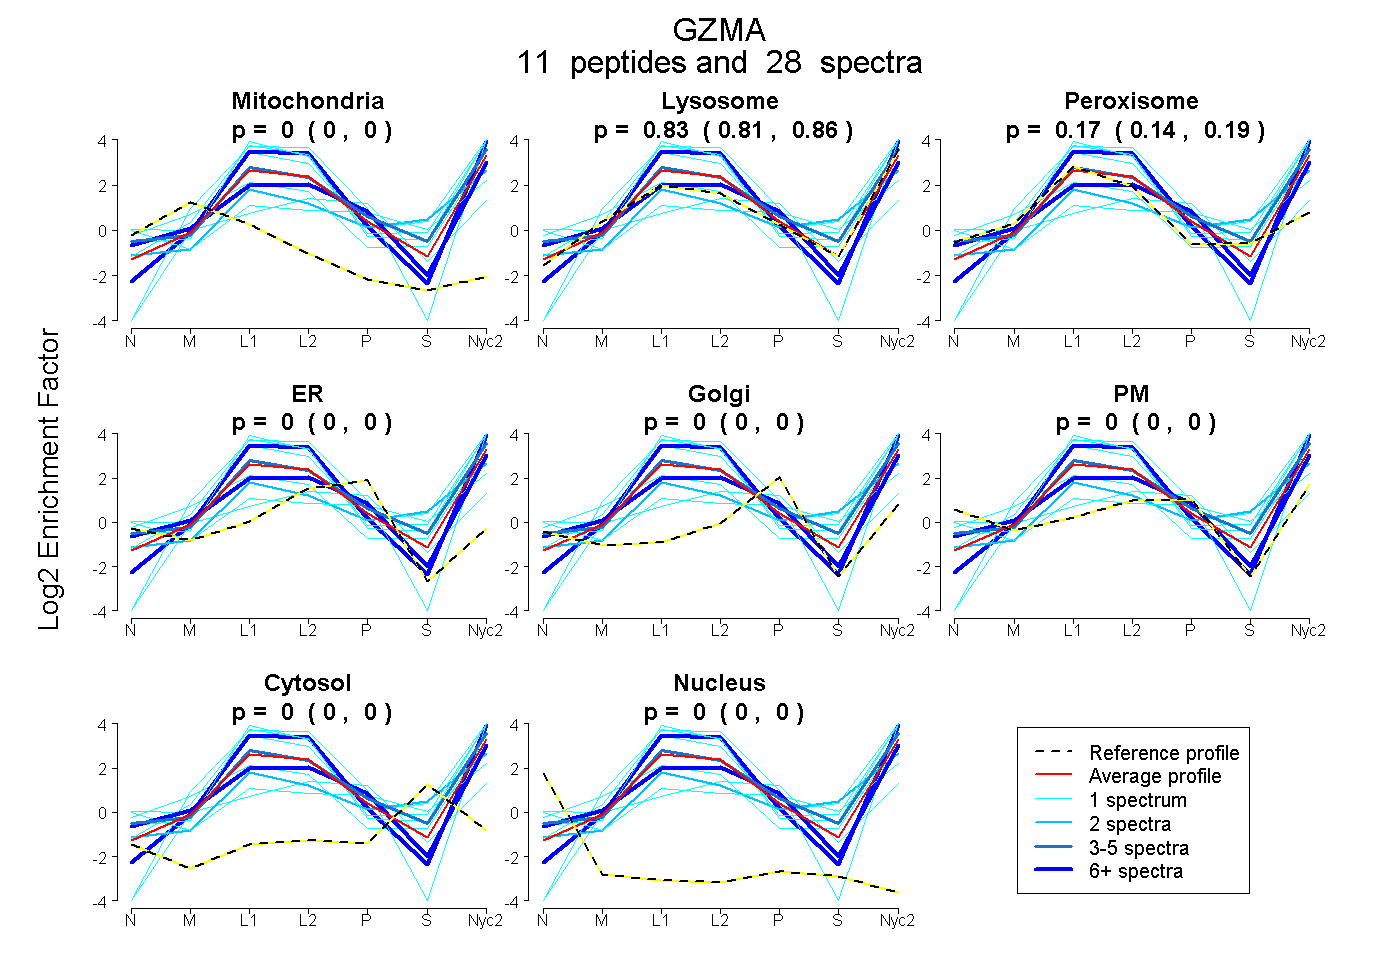
0.000 | 0.000
0.806 | 0.857
0.137 | 0.189
0.000 | 0.000
0.000 | 0.000
0.000 | 0.000
0.000 | 0.000
0.000 | 0.000
9peptides
spectra
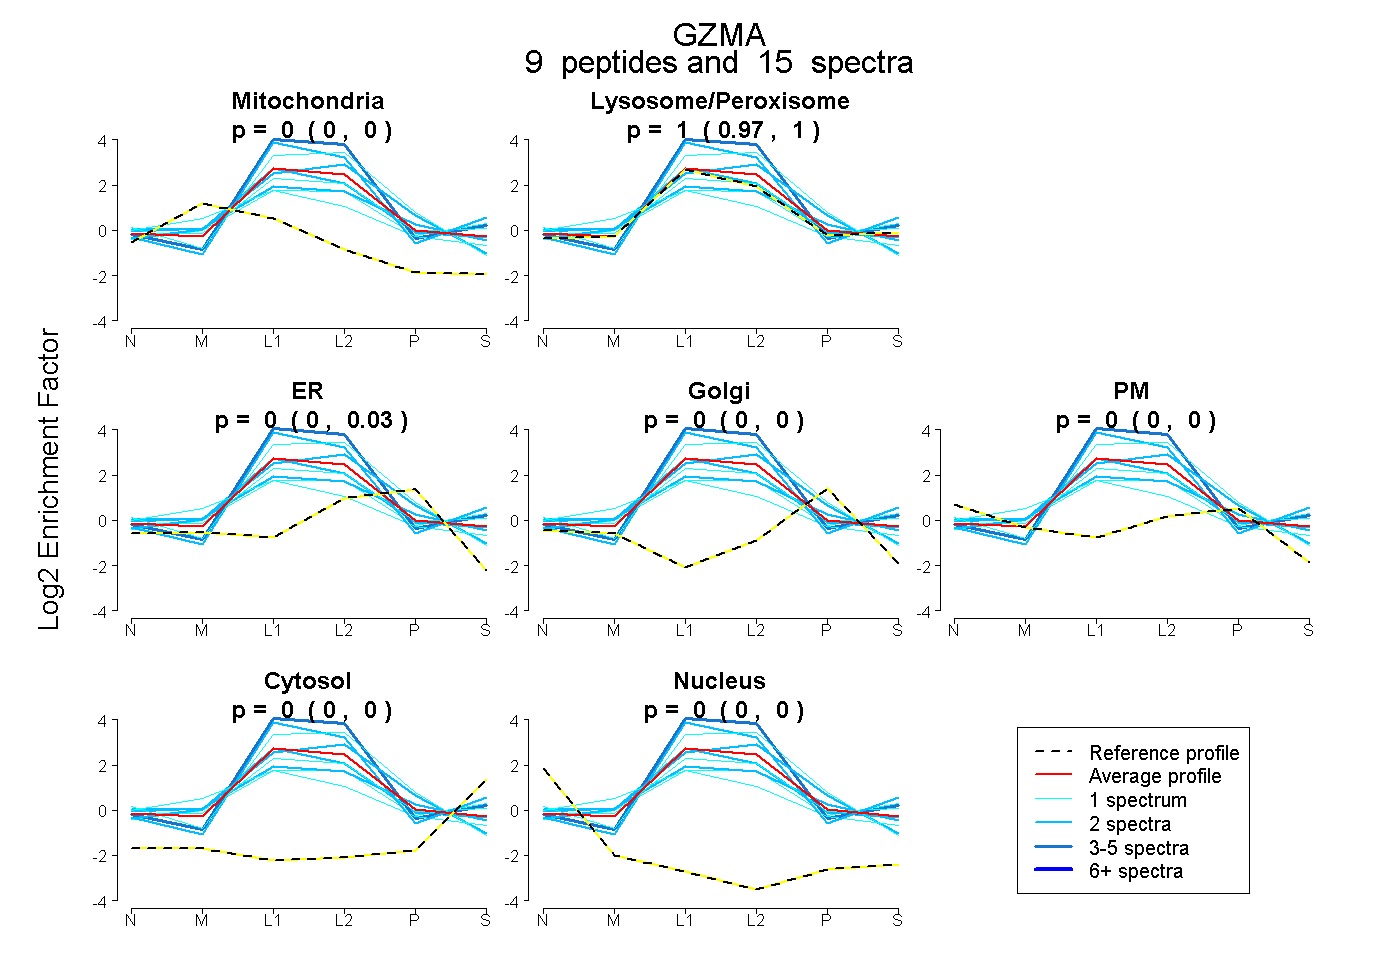
0.000 | 0.000
0.965 | 1.000
0.000 | 0.028
0.000 | 0.000
0.000 | 0.000
0.000 | 0.000
0.000 | 0.000