 11
11peptides
spectra
0.000 | 0.000
0.806 | 0.857
0.137 | 0.189
0.000 | 0.000
0.000 | 0.000
0.000 | 0.000
0.000 | 0.000
0.000 | 0.000
| Plot | Mito | Lyso | Perox | ER | Golgi | PM | Cytosol | Nucleus | |||||
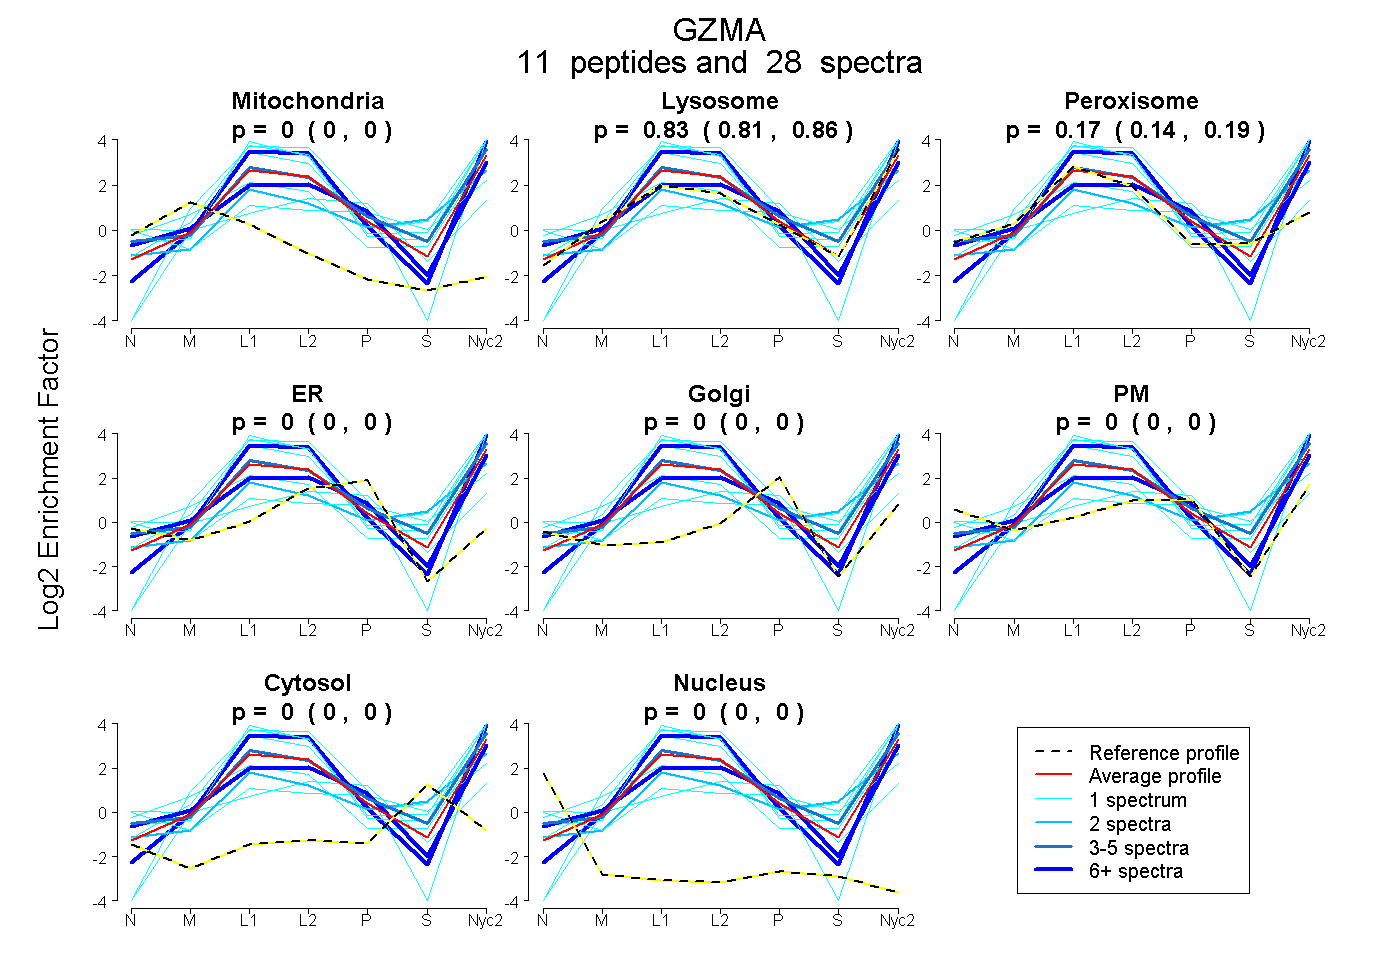
| Expt A |
11 peptides |
28 spectra |
|
0.000 0.000 | 0.000 |
0.834 0.806 | 0.857 |
0.166 0.137 | 0.189 |
0.000 0.000 | 0.000 |
0.000 0.000 | 0.000 |
0.000 0.000 | 0.000 |
0.000 0.000 | 0.000 |
0.000 0.000 | 0.000 |
| 1 spectrum, NWVLTAAHCIPGK | 0.000 | 0.806 | 0.194 | 0.000 | 0.000 | 0.000 | 0.000 | 0.000 | ||
| 8 spectra, HLDWIR | 0.000 | 1.000 | 0.000 | 0.000 | 0.000 | 0.000 | 0.000 | 0.000 | ||
| 5 spectra, SPPSDTLR | 0.000 | 0.804 | 0.196 | 0.000 | 0.000 | 0.000 | 0.000 | 0.000 | ||
| 1 spectrum, NVAILHLPK | 0.000 | 0.404 | 0.093 | 0.000 | 0.000 | 0.295 | 0.208 | 0.000 | ||
| 2 spectra, HTHEGDLQLLR | 0.000 | 0.659 | 0.125 | 0.000 | 0.000 | 0.000 | 0.216 | 0.000 | ||
| 1 spectrum, IIGGDTVVPHSRPYMVLLK | 0.000 | 1.000 | 0.000 | 0.000 | 0.000 | 0.000 | 0.000 | 0.000 | ||
| 6 spectra, SEVILGAHSIK | 0.000 | 0.701 | 0.009 | 0.073 | 0.000 | 0.217 | 0.000 | 0.000 | ||
| 1 spectrum, GPGIYTLLSDK | 0.000 | 0.679 | 0.316 | 0.000 | 0.000 | 0.000 | 0.000 | 0.004 | ||
| 1 spectrum, EPEQQILSVK | 0.000 | 1.000 | 0.000 | 0.000 | 0.000 | 0.000 | 0.000 | 0.000 | ||
| 1 spectrum, CHVAGWGR | 0.000 | 0.109 | 0.239 | 0.154 | 0.109 | 0.389 | 0.000 | 0.000 | ||
| 1 spectrum, LKPDSVCAGALIAK | 0.000 | 0.719 | 0.281 | 0.000 | 0.000 | 0.000 | 0.000 | 0.000 |
| Plot | Mito | Lyso or Perox | ER | Golgi | PM | Cytosol | Nucleus | ||||||
| Expt B |
9 peptides |
15 spectra |
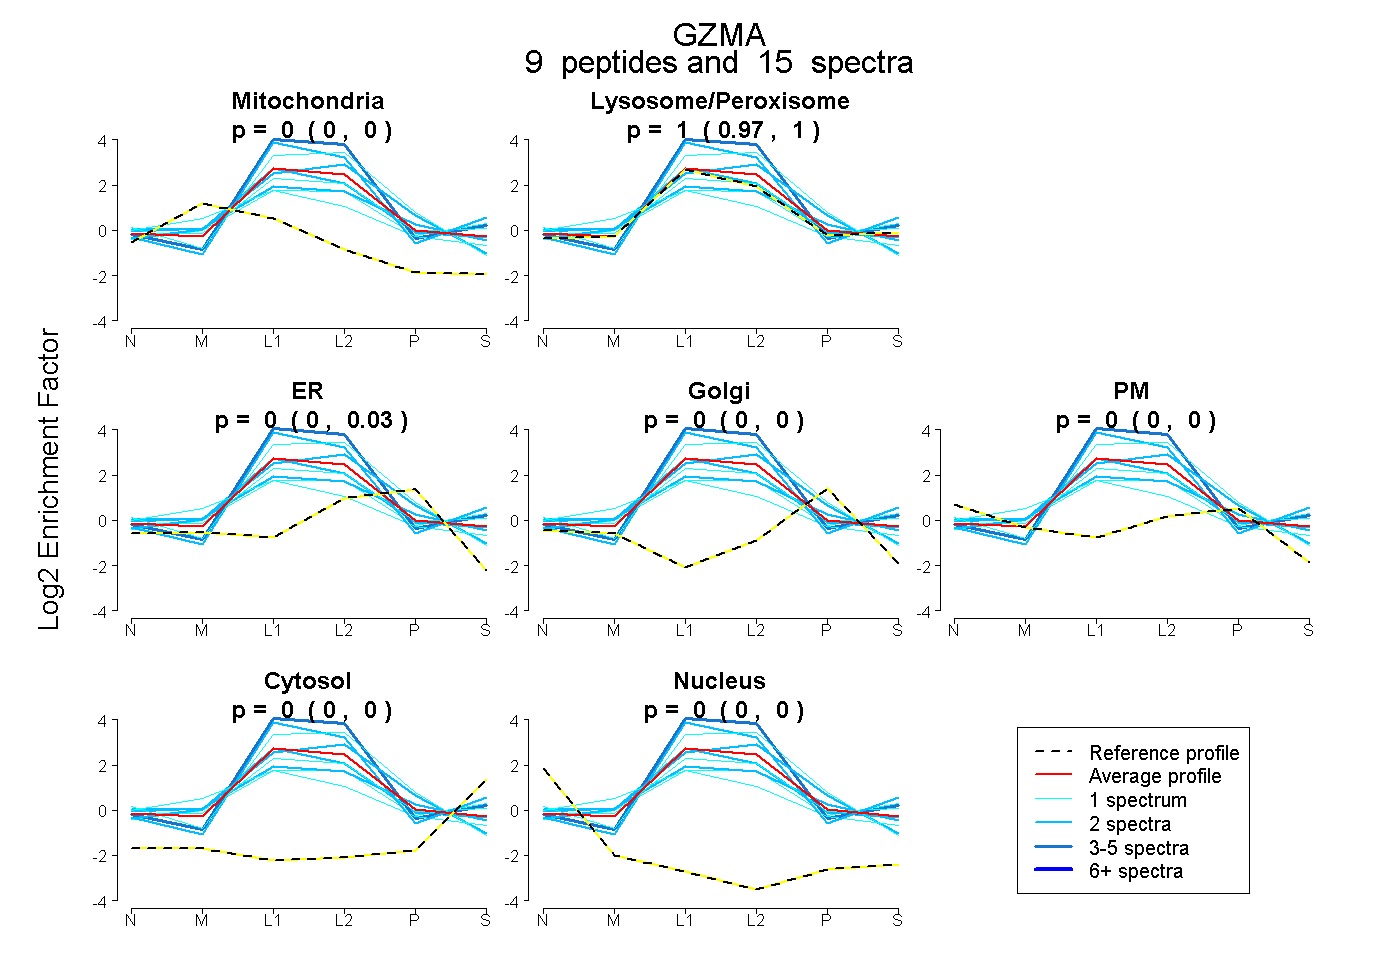 |
0.000 0.000 | 0.000 |
0.997 0.965 | 1.000 |
0.003 0.000 | 0.028 |
0.000 0.000 | 0.000 |
0.000 0.000 | 0.000 |
0.000 0.000 | 0.000 |
0.000 0.000 | 0.000 |
|||
| Plot | Lyso | Other | |||||||||||
| Expt C |
14 peptides |
127 spectra |
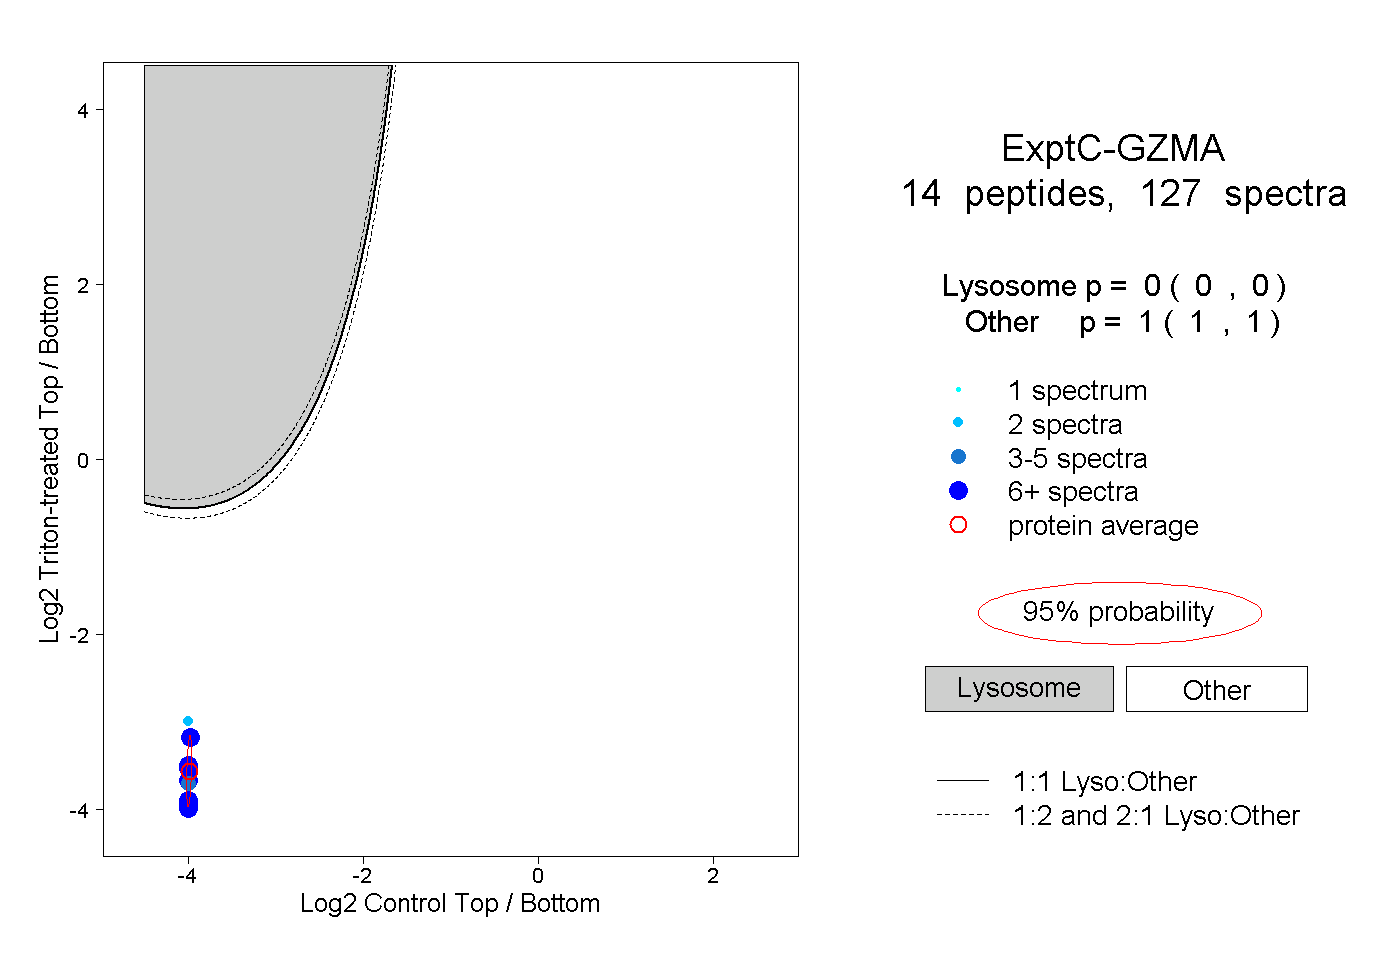 |
0.000 0.000 | 0.000 |
1.000 1.000 | 1.000 |
||||||||
| Plot | Lyso | Other | |||||||||||
| Expt D |
3 peptides |
6 spectra |
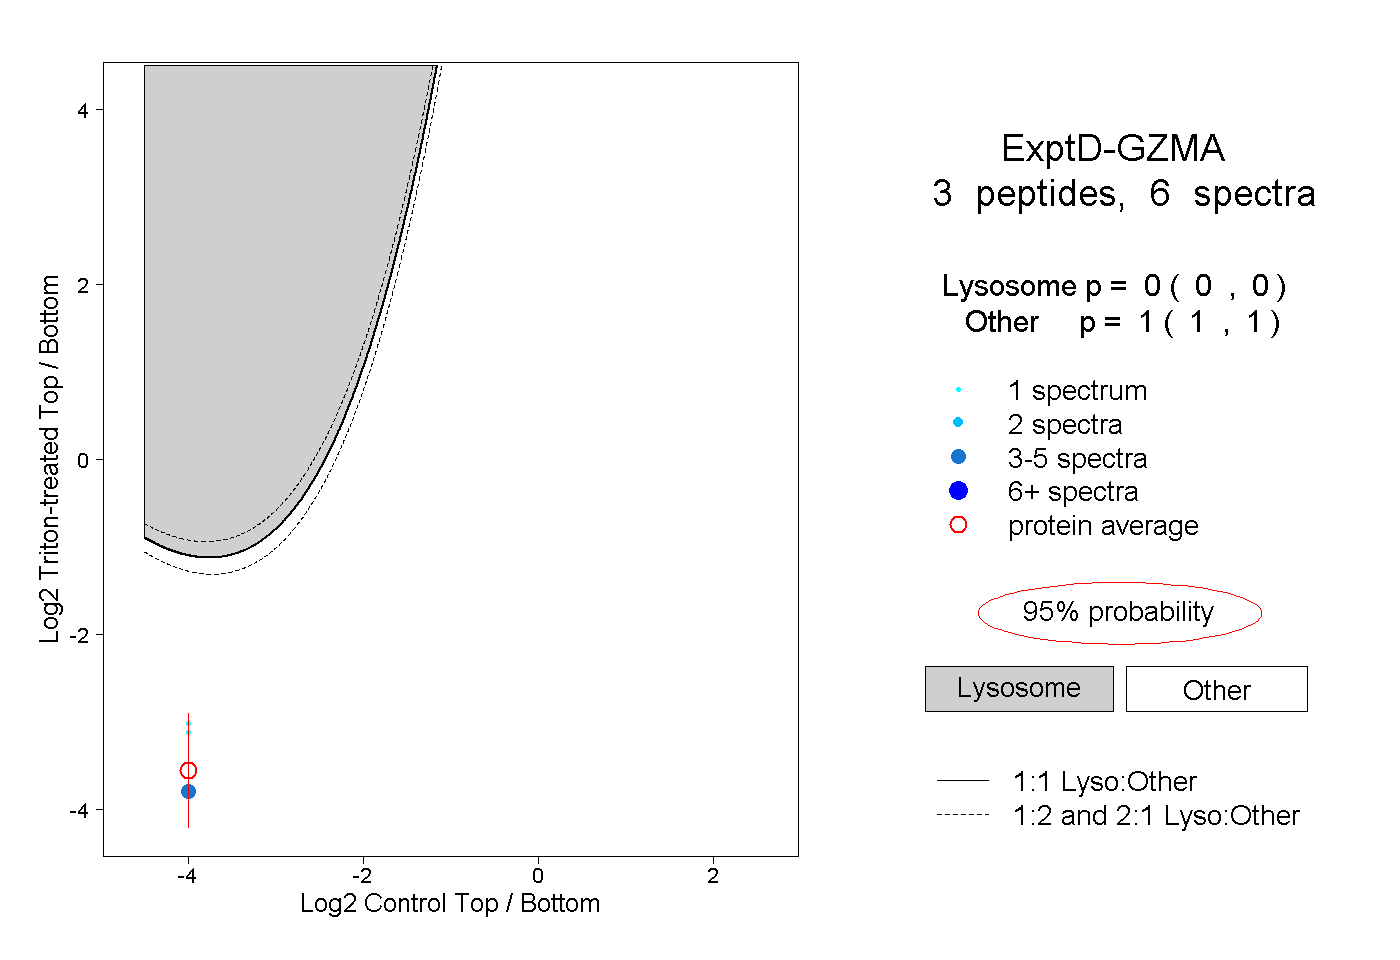 |
0.000 0.000 | 0.000 |
1.000 1.000 | 1.000 |