FLOT2
[ENSRNOP00000014118]
Main page
| | | Plot |
Mito |
Lyso |
|
Perox |
ER |
Golgi |
PM |
Cytosol |
Nucleus |
|
| Expt A |
 12
12
peptides |
21
spectra |
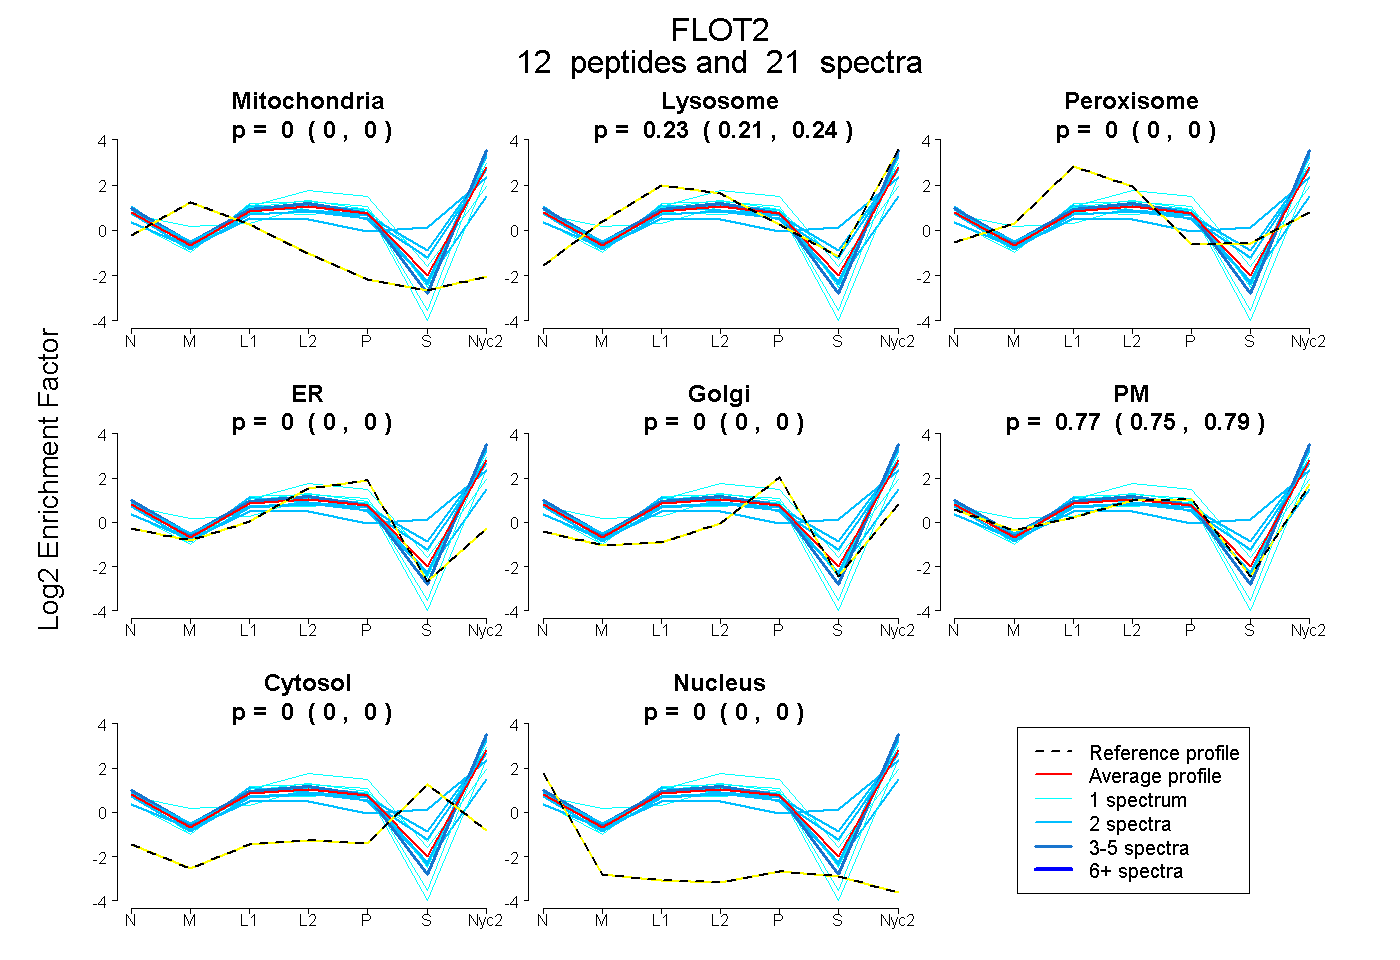 |
0.000
0.000 | 0.000 |
0.229
0.211 | 0.244 |
|
0.000
0.000 | 0.000 |
0.000
0.000 | 0.000 |
0.000
0.000 | 0.000 |
0.771
0.753 | 0.787 |
0.000
0.000 | 0.000 |
0.000
0.000 | 0.000 |
|
| | | Plot |
Mito |
|
Lyso or Perox |
|
ER |
Golgi |
PM |
Cytosol |
Nucleus |
|
| Expt B |
2
peptides |
2
spectra |
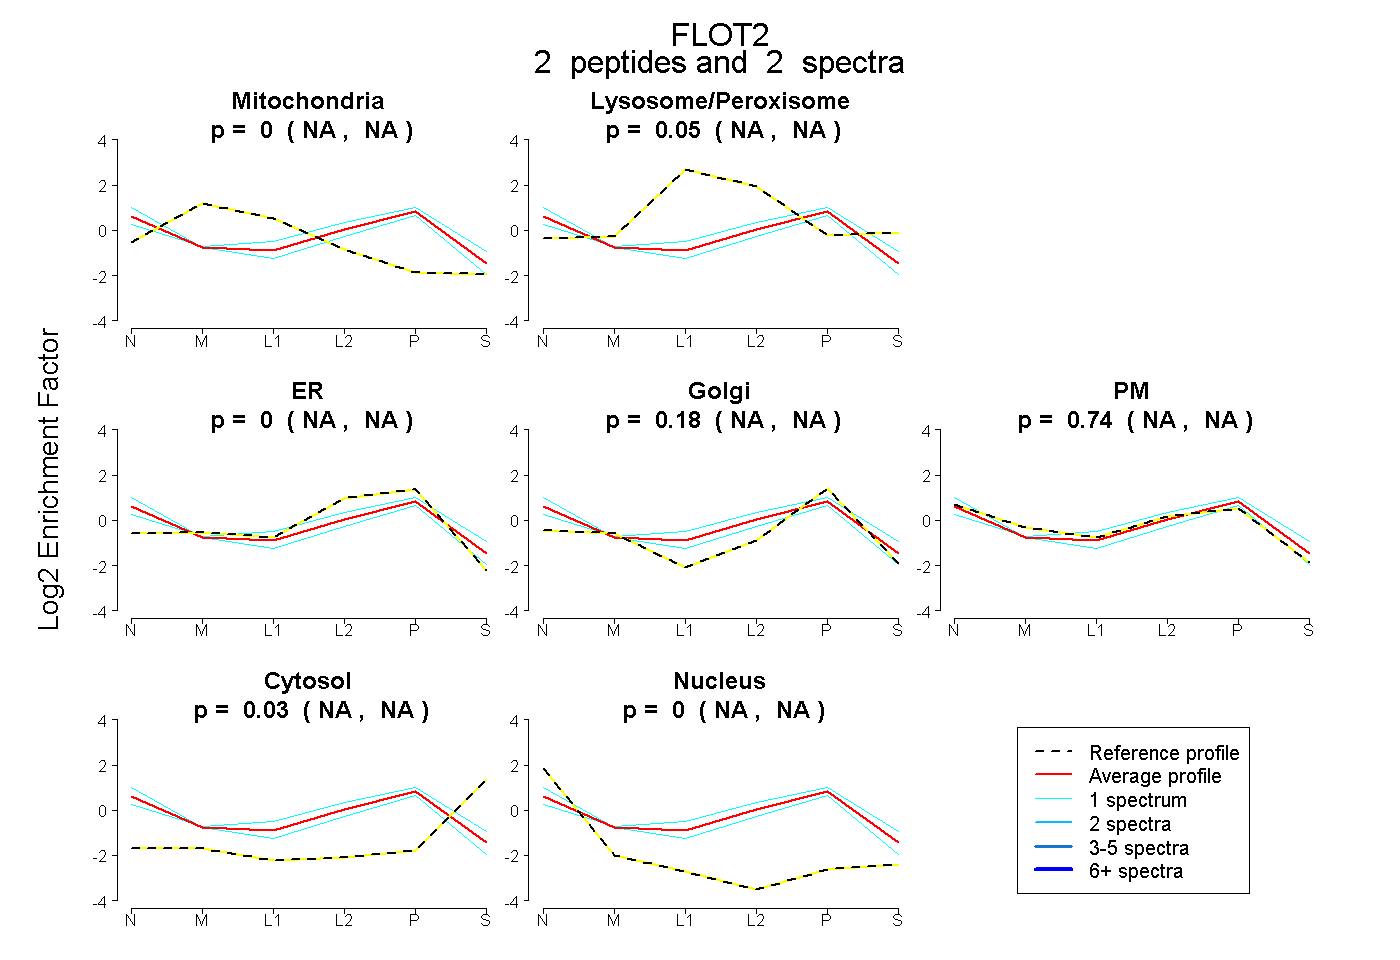 |
0.000
NA | NA |
|
0.053
NA | NA |
|
0.000
NA | NA |
0.175
NA | NA |
0.742
NA | NA |
0.030
NA | NA |
0.000
NA | NA |
|
| | | Plot |
|
Lyso |
|
|
|
|
|
|
|
Other |
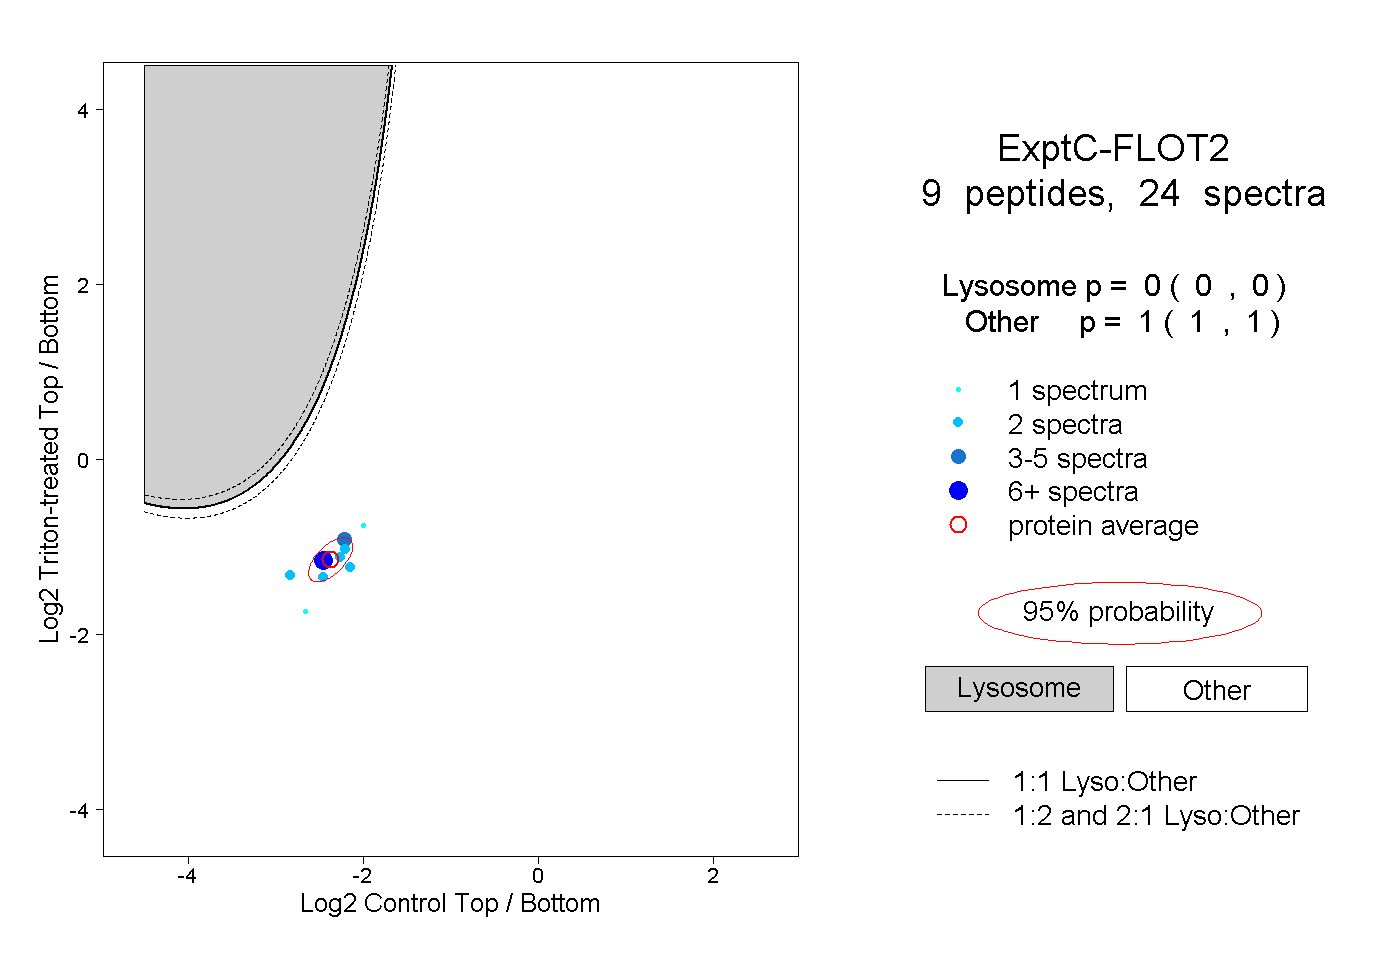
| Expt C |
9
peptides |
24
spectra |
 |
|
0.000
0.000 | 0.000 |
|
|
|
|
|
|
|
1.000
1.000 | 1.000 |
| 2 spectra, VTSEVNR |
|
0.000 |
|
|
|
|
|
|
|
1.000 |
| 2 spectra, EVAAPDVGR |
|
0.000 |
|
|
|
|
|
|
|
1.000 |
| 2 spectra, QIAVEAQEILR |
|
0.000 |
|
|
|
|
|
|
|
1.000 |
| 4 spectra, DADIGVAEAER |
|
0.000 |
|
|
|
|
|
|
|
1.000 |
| 1 spectrum, FMADTK |
|
0.000 |
|
|
|
|
|
|
|
1.000 |
| 8 spectra, YGDAAK |
|
0.000 |
|
|
|
|
|
|
|
1.000 |
| 2 spectra, ISAPLTK |
|
0.000 |
|
|
|
|
|
|
|
1.000 |
| 2 spectra, IQQIAEGEK |
|
0.000 |
|
|
|
|
|
|
|
1.000 |
| 1 spectrum, IADSK |
|
0.000 |
|
|
|
|
|
|
|
1.000 |
| | | Plot |
|
Lyso |
|
|
|
|
|
|
|
Other |
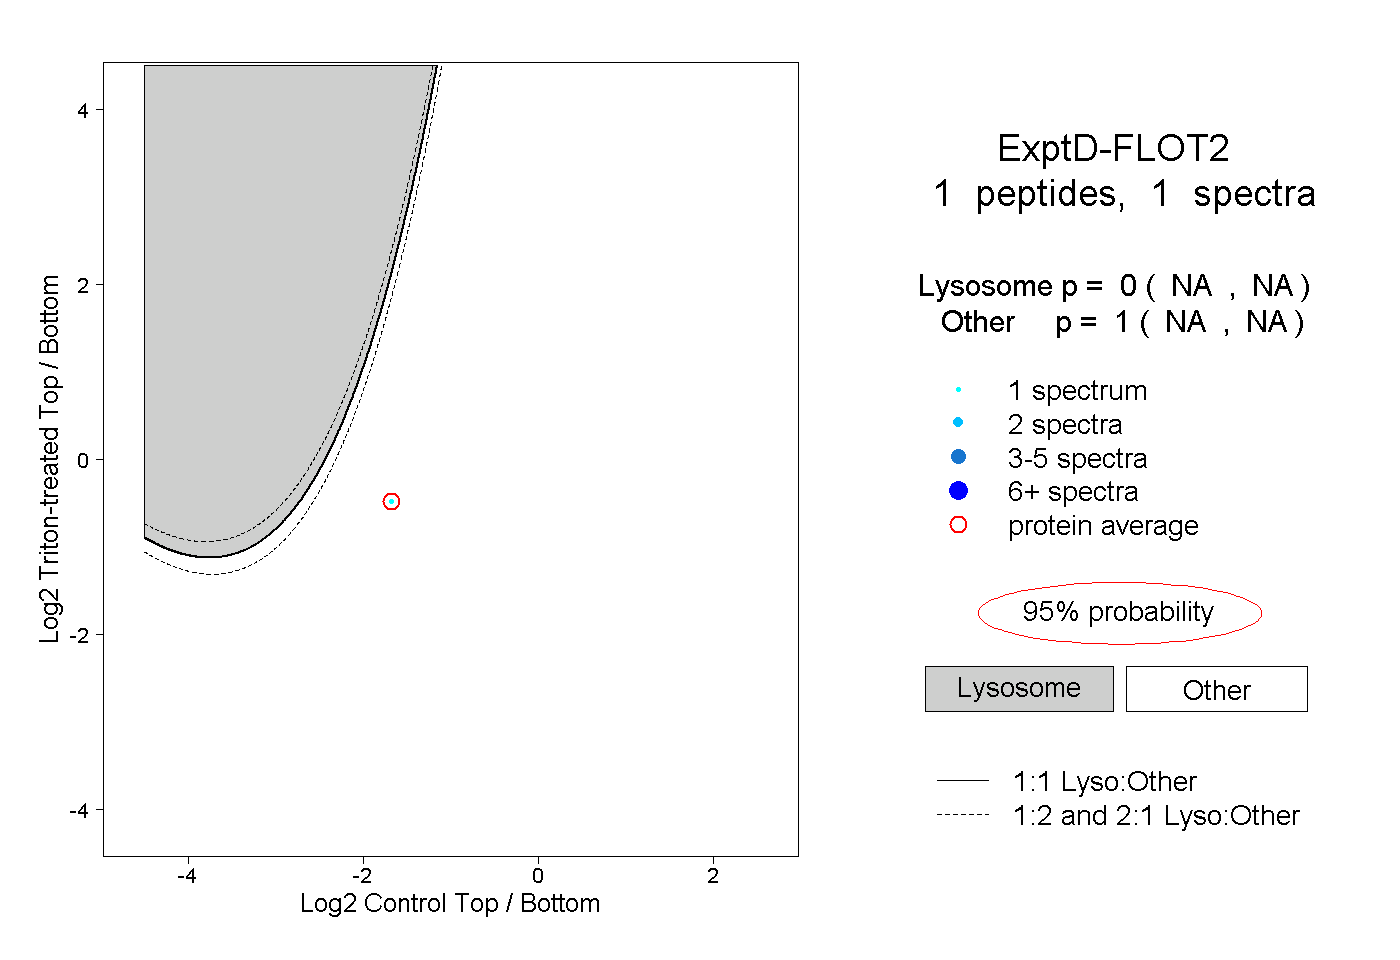
| Expt D |
1
peptide |
1
spectrum |
 |
|
0.000
NA | NA |
|
|
|
|
|
|
|
1.000
NA | NA |