 12
12peptides
spectra
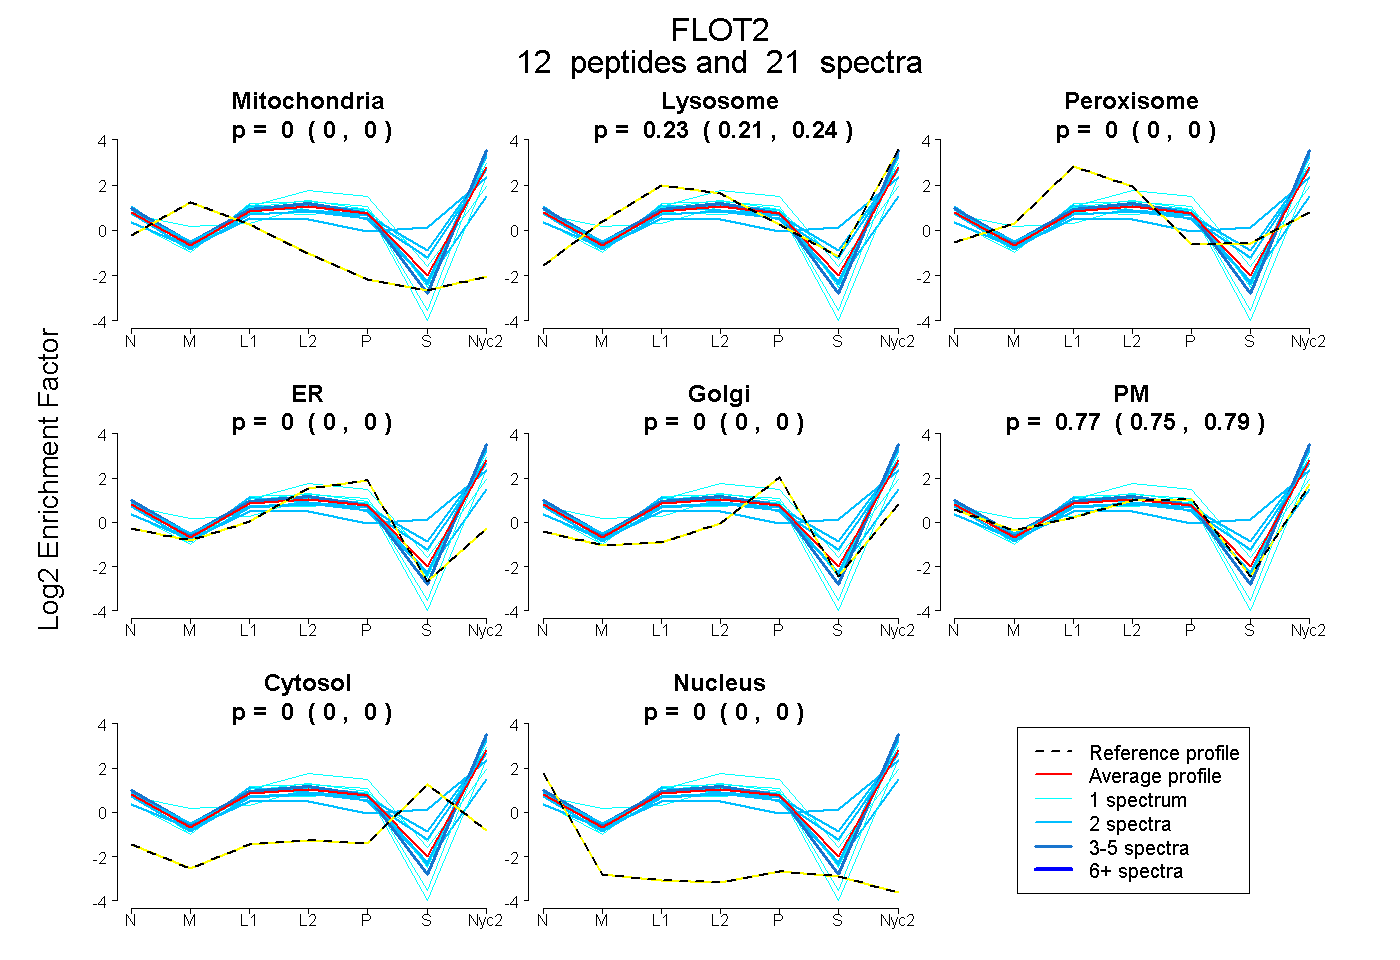
0.000 | 0.000
0.211 | 0.244
0.000 | 0.000
0.000 | 0.000
0.000 | 0.000
0.753 | 0.787
0.000 | 0.000
0.000 | 0.000
| Plot | Mito | Lyso | Perox | ER | Golgi | PM | Cytosol | Nucleus | |||||
| Expt A |
12 peptides |
21 spectra |
|
0.000 0.000 | 0.000 |
0.229 0.211 | 0.244 |
0.000 0.000 | 0.000 |
0.000 0.000 | 0.000 |
0.000 0.000 | 0.000 |
0.771 0.753 | 0.787 |
0.000 0.000 | 0.000 |
0.000 0.000 | 0.000 |
| 2 spectra, VTSEVNR | 0.000 | 0.283 | 0.000 | 0.000 | 0.000 | 0.655 | 0.063 | 0.000 | ||
| 4 spectra, TQTAVVQR | 0.000 | 0.248 | 0.000 | 0.000 | 0.000 | 0.752 | 0.000 | 0.000 | ||
| 2 spectra, QIAVEAQEILR | 0.000 | 0.265 | 0.000 | 0.000 | 0.000 | 0.735 | 0.000 | 0.000 | ||
| 1 spectrum, IGEAEAAVIEAMGK | 0.000 | 0.269 | 0.000 | 0.000 | 0.000 | 0.731 | 0.000 | 0.000 | ||
| 2 spectra, DADIGVAEAER | 0.000 | 0.247 | 0.000 | 0.000 | 0.000 | 0.753 | 0.000 | 0.000 | ||
| 1 spectrum, NVVLQTLEGHLR | 0.000 | 0.000 | 0.000 | 0.000 | 0.000 | 1.000 | 0.000 | 0.000 | ||
| 2 spectra, ELLAVACEQFLGK | 0.000 | 0.000 | 0.176 | 0.000 | 0.000 | 0.791 | 0.000 | 0.033 | ||
| 2 spectra, TAEAQLAYELQGAR | 0.000 | 0.386 | 0.017 | 0.000 | 0.000 | 0.310 | 0.287 | 0.000 | ||
| 1 spectrum, ISLEIMTLQPR | 0.000 | 0.136 | 0.000 | 0.000 | 0.000 | 0.864 | 0.000 | 0.000 | ||
| 1 spectrum, MALVLEALPQIAAK | 0.000 | 0.297 | 0.000 | 0.000 | 0.000 | 0.669 | 0.034 | 0.000 | ||
| 2 spectra, RPAEAEAHR | 0.000 | 0.304 | 0.000 | 0.000 | 0.000 | 0.595 | 0.101 | 0.000 | ||
| 1 spectrum, QVLLAQAEAEK | 0.000 | 0.197 | 0.078 | 0.160 | 0.000 | 0.565 | 0.000 | 0.000 |
| Plot | Mito | Lyso or Perox | ER | Golgi | PM | Cytosol | Nucleus | ||||||
| Expt B |
2 peptides |
2 spectra |
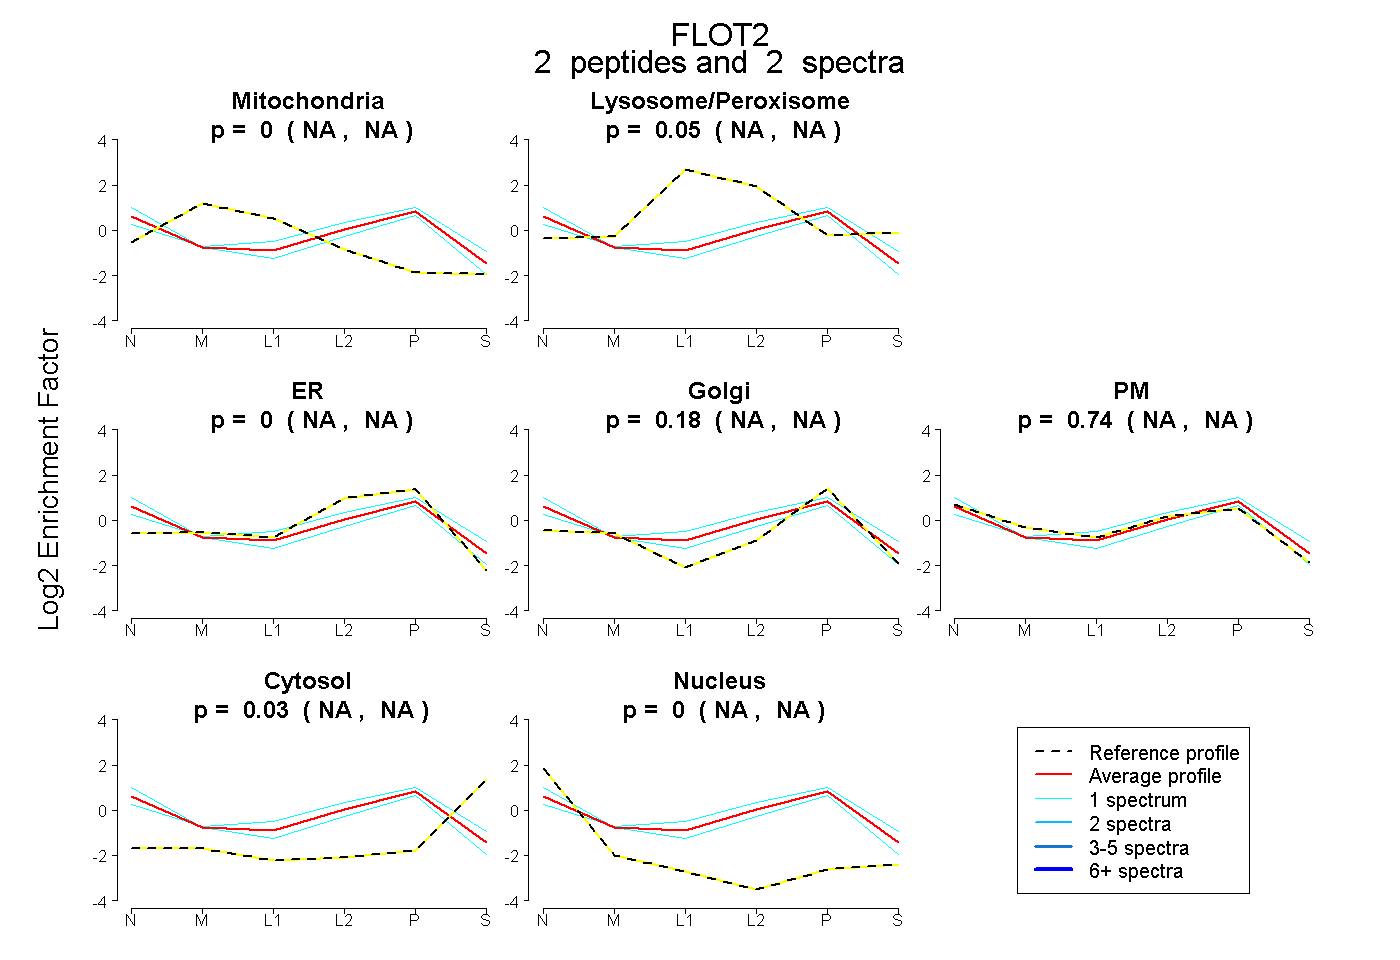 |
0.000 NA | NA |
0.053 NA | NA |
0.000 NA | NA |
0.175 NA | NA |
0.742 NA | NA |
0.030 NA | NA |
0.000 NA | NA |
|||
| Plot | Lyso | Other | |||||||||||
| Expt C |
9 peptides |
24 spectra |
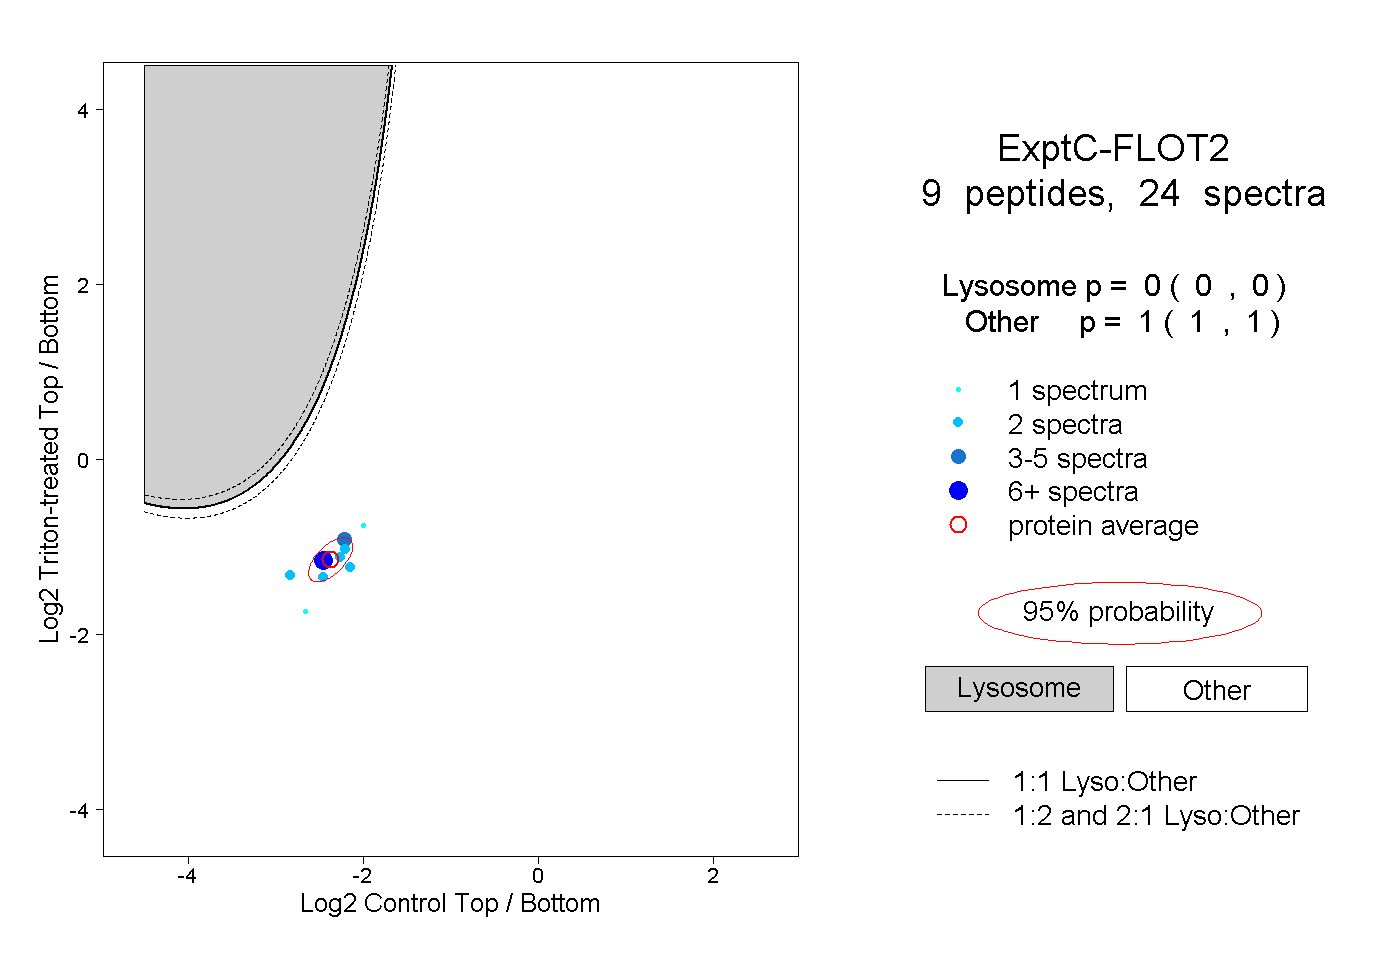 |
0.000 0.000 | 0.000 |
1.000 1.000 | 1.000 |
||||||||
| Plot | Lyso | Other | |||||||||||
| Expt D |
1 peptide |
1 spectrum |
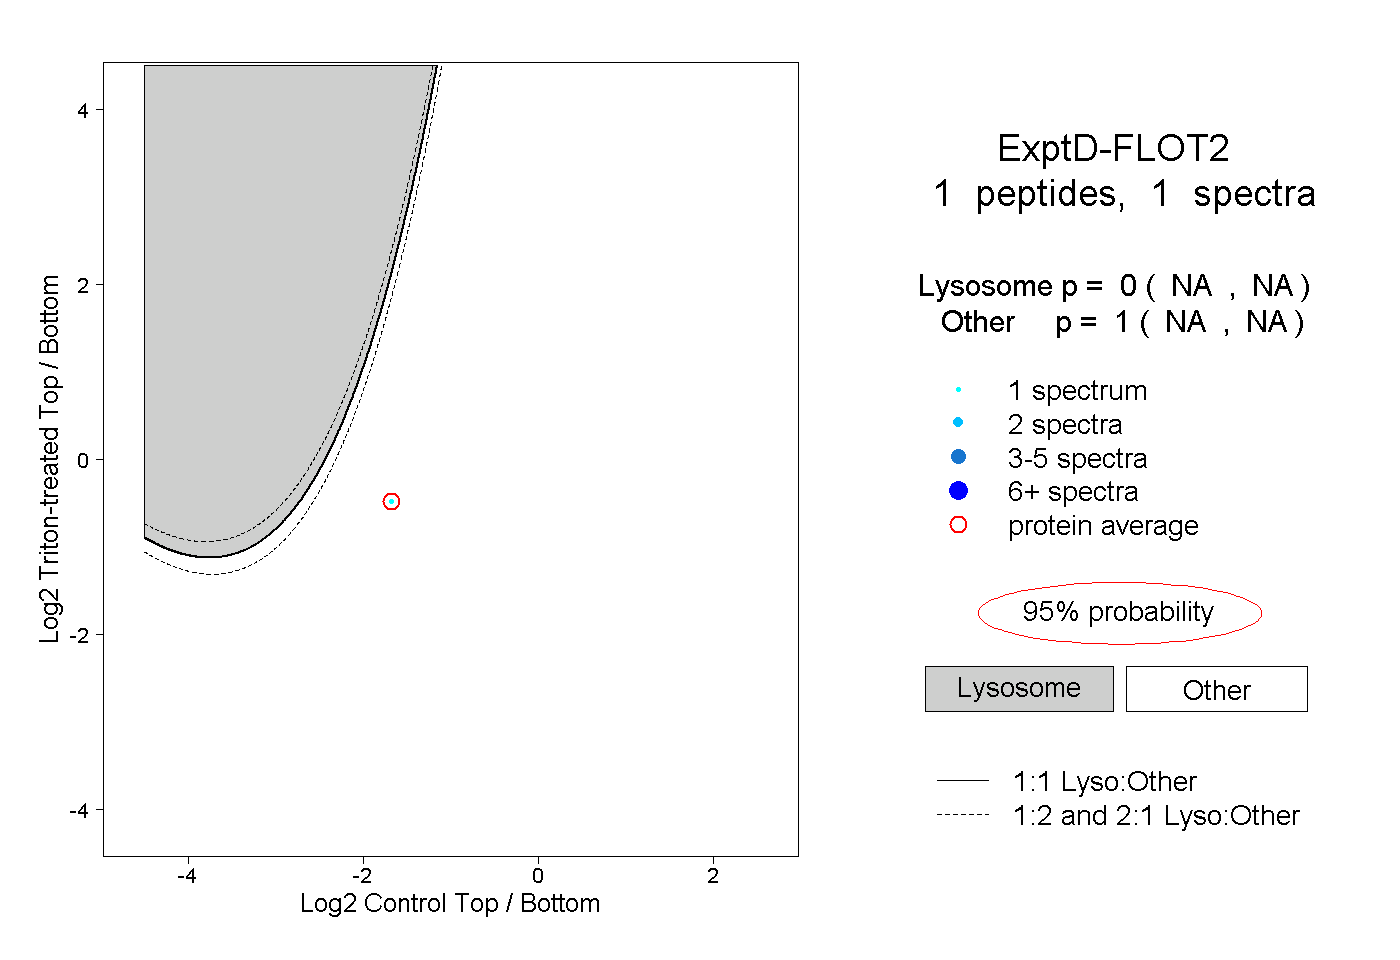 |
0.000 NA | NA |
1.000 NA | NA |