 1
1peptide
spectra
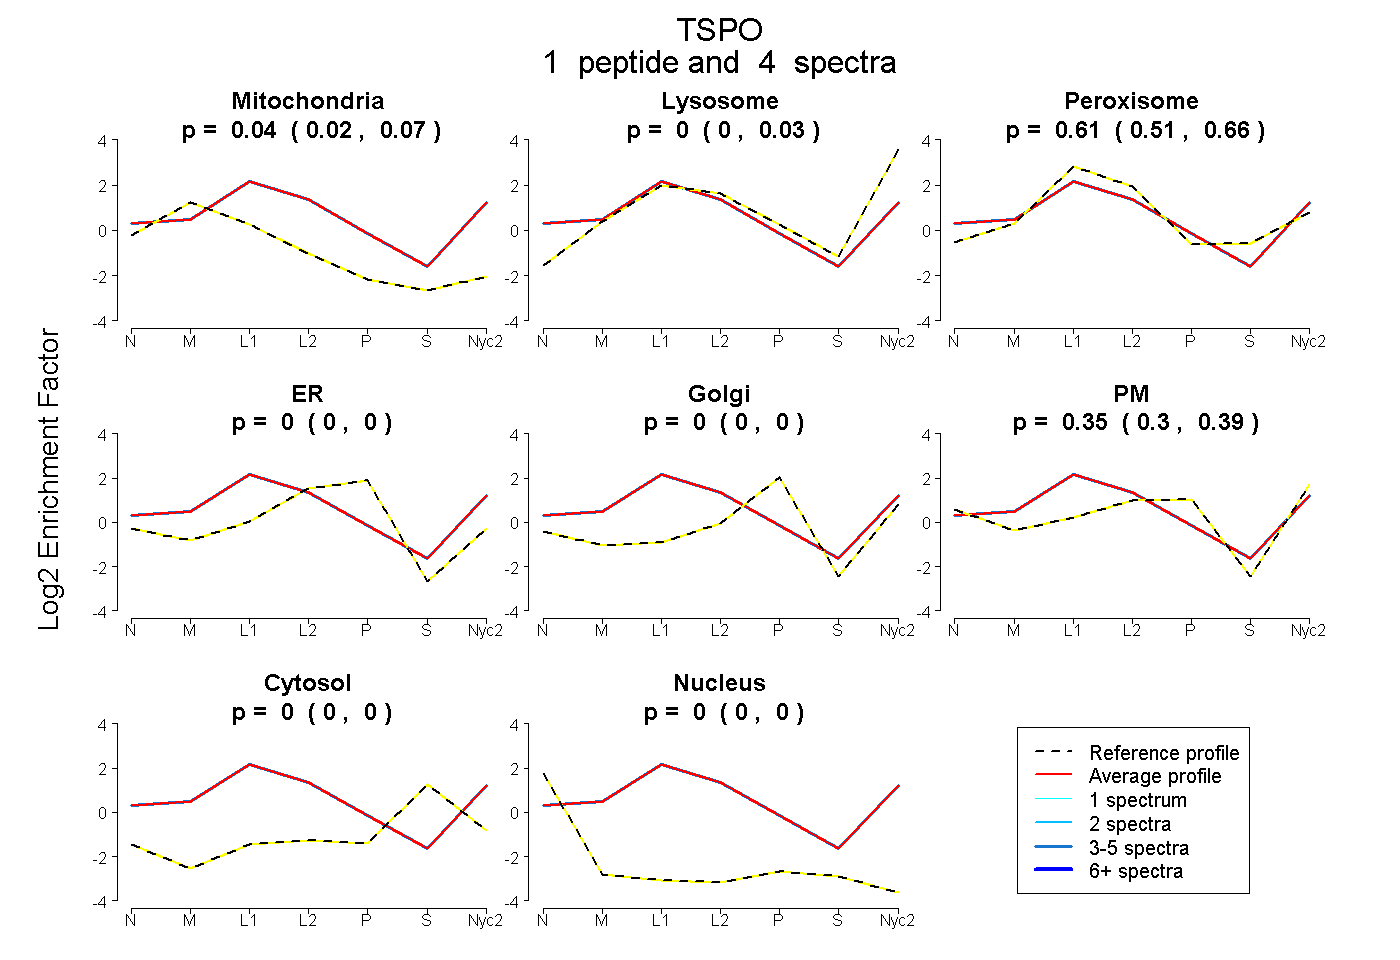
0.016 | 0.071
0.000 | 0.033
0.512 | 0.662
0.000 | 0.000
0.000 | 0.000
0.300 | 0.386
0.000 | 0.000
0.000 | 0.000
1peptide
spectra
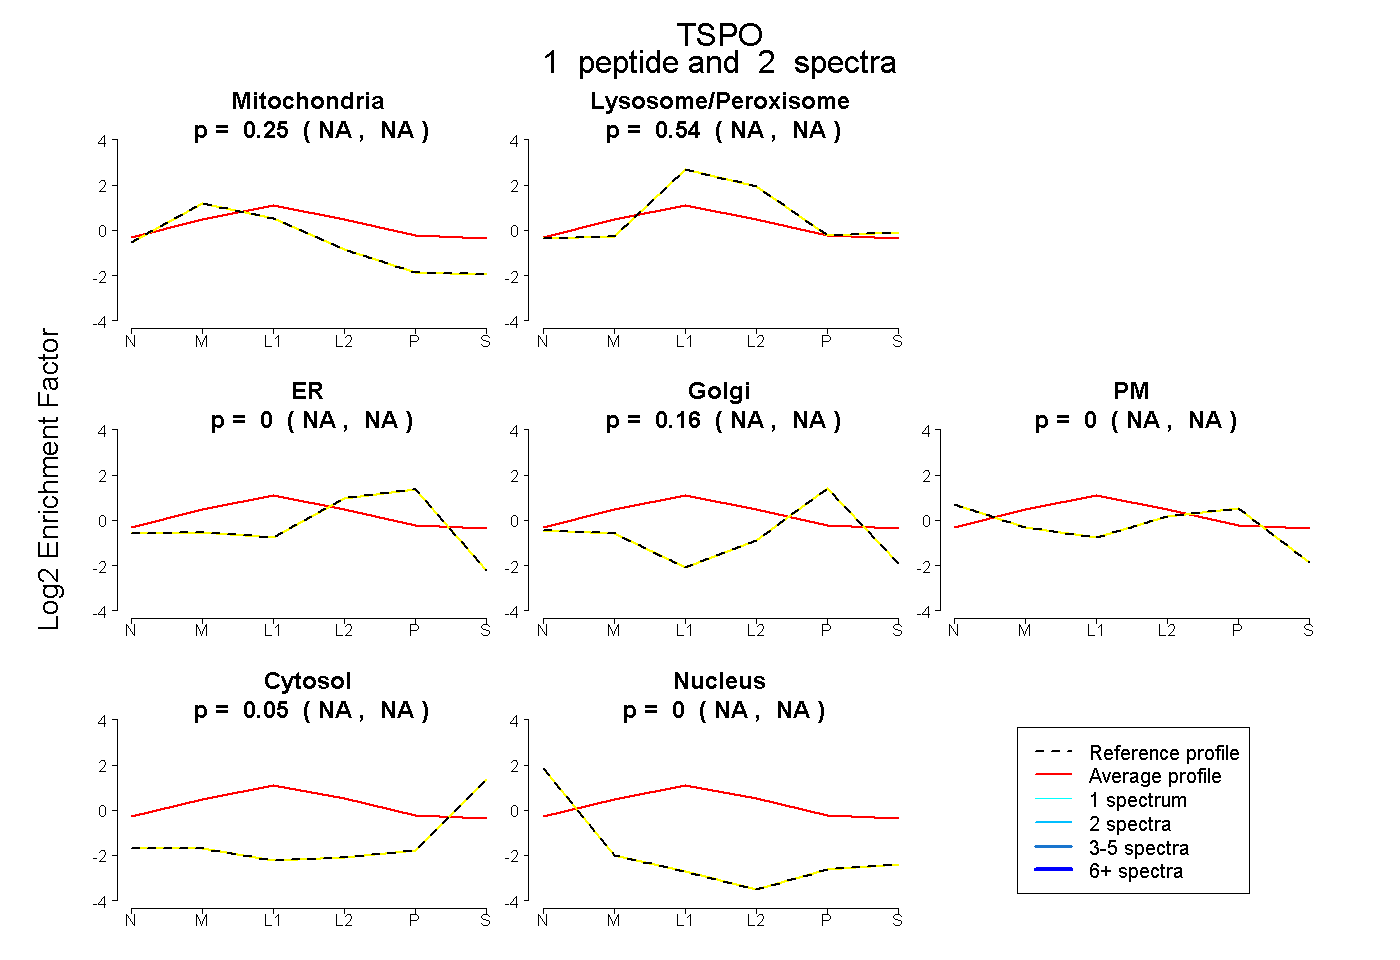
NA | NA
NA | NA
NA | NA
NA | NA
NA | NA
NA | NA
NA | NA
1peptide
spectra
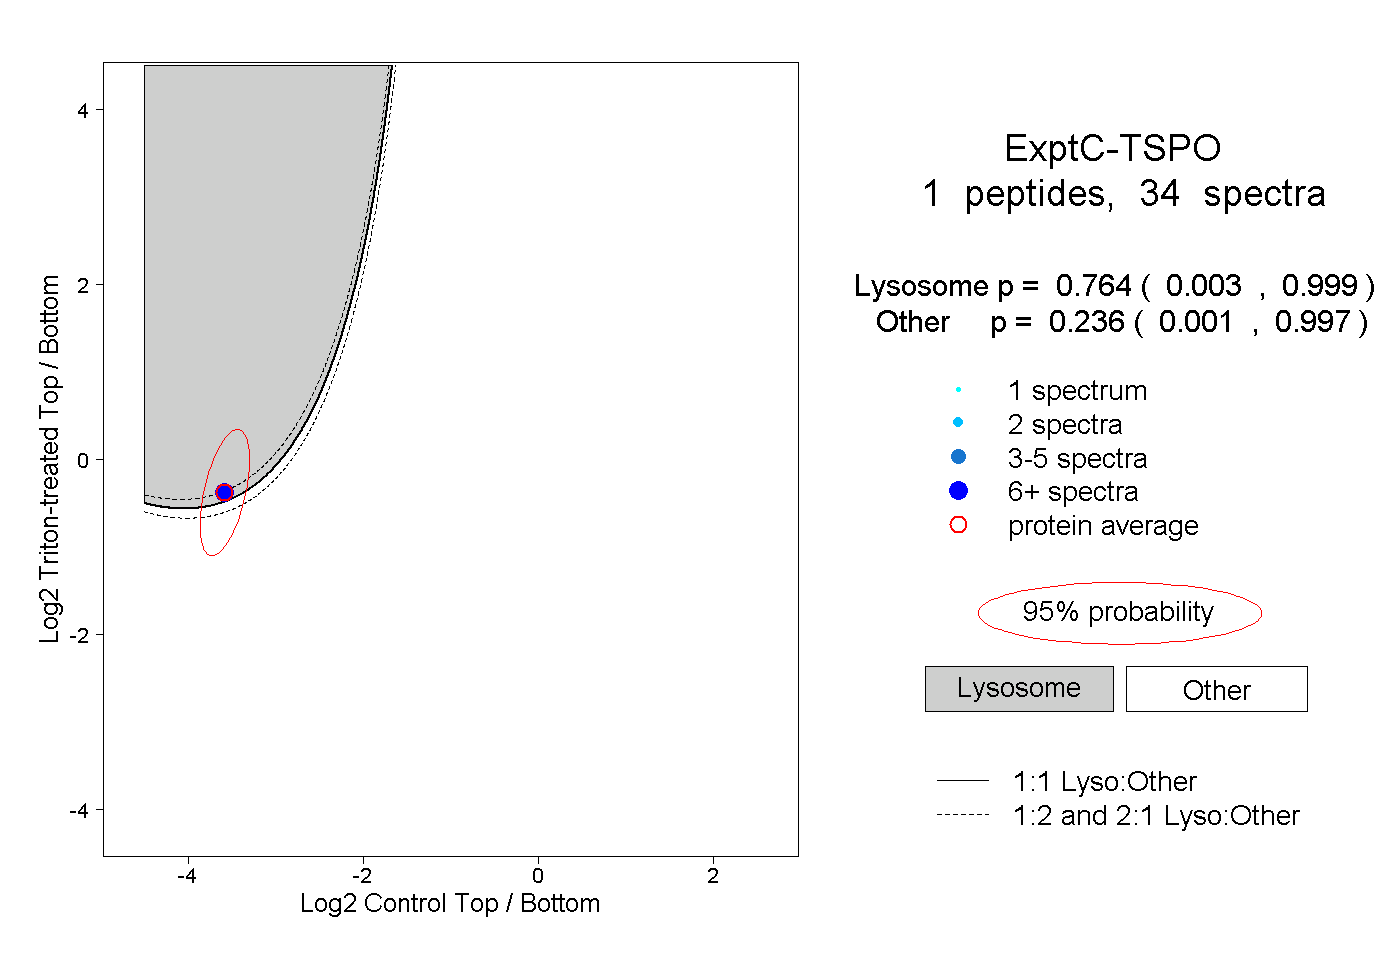
0.003 | 0.999
0.001 | 0.997
1peptide
spectra
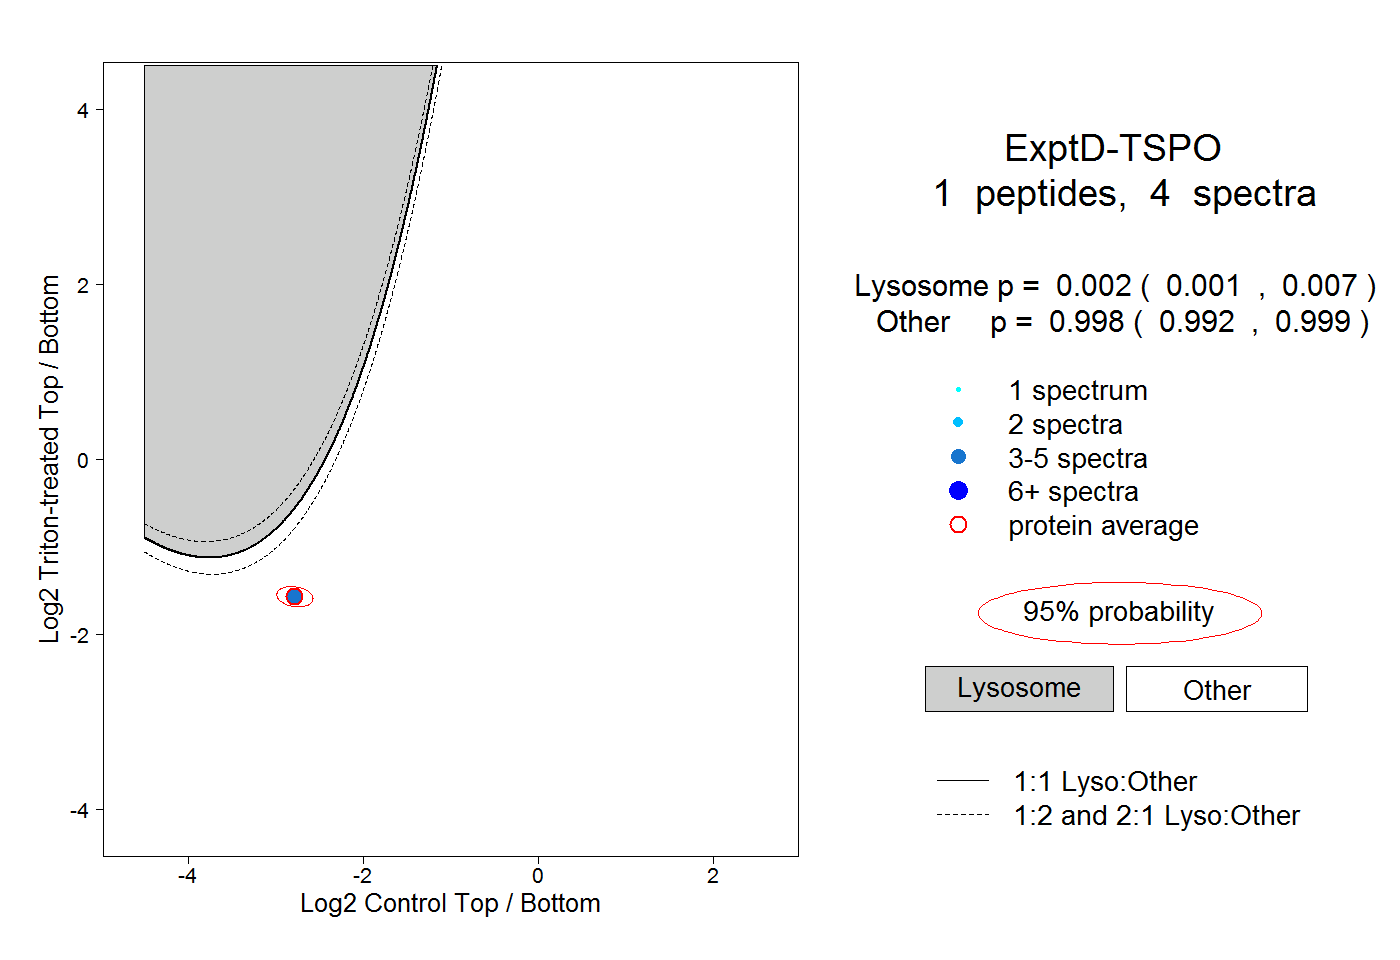
0.001 | 0.007
0.992 | 0.999