 10
10peptides
spectra
0.049 | 0.097
0.000 | 0.000
0.000 | 0.030
0.783 | 0.840
0.000 | 0.000
0.000 | 0.041
0.058 | 0.105
0.000 | 0.009
5peptides
spectra
0.000 | 0.000
1.000 | 1.000
| Plot | Mito | Lyso | Perox | ER | Golgi | PM | Cytosol | Nucleus | |||||
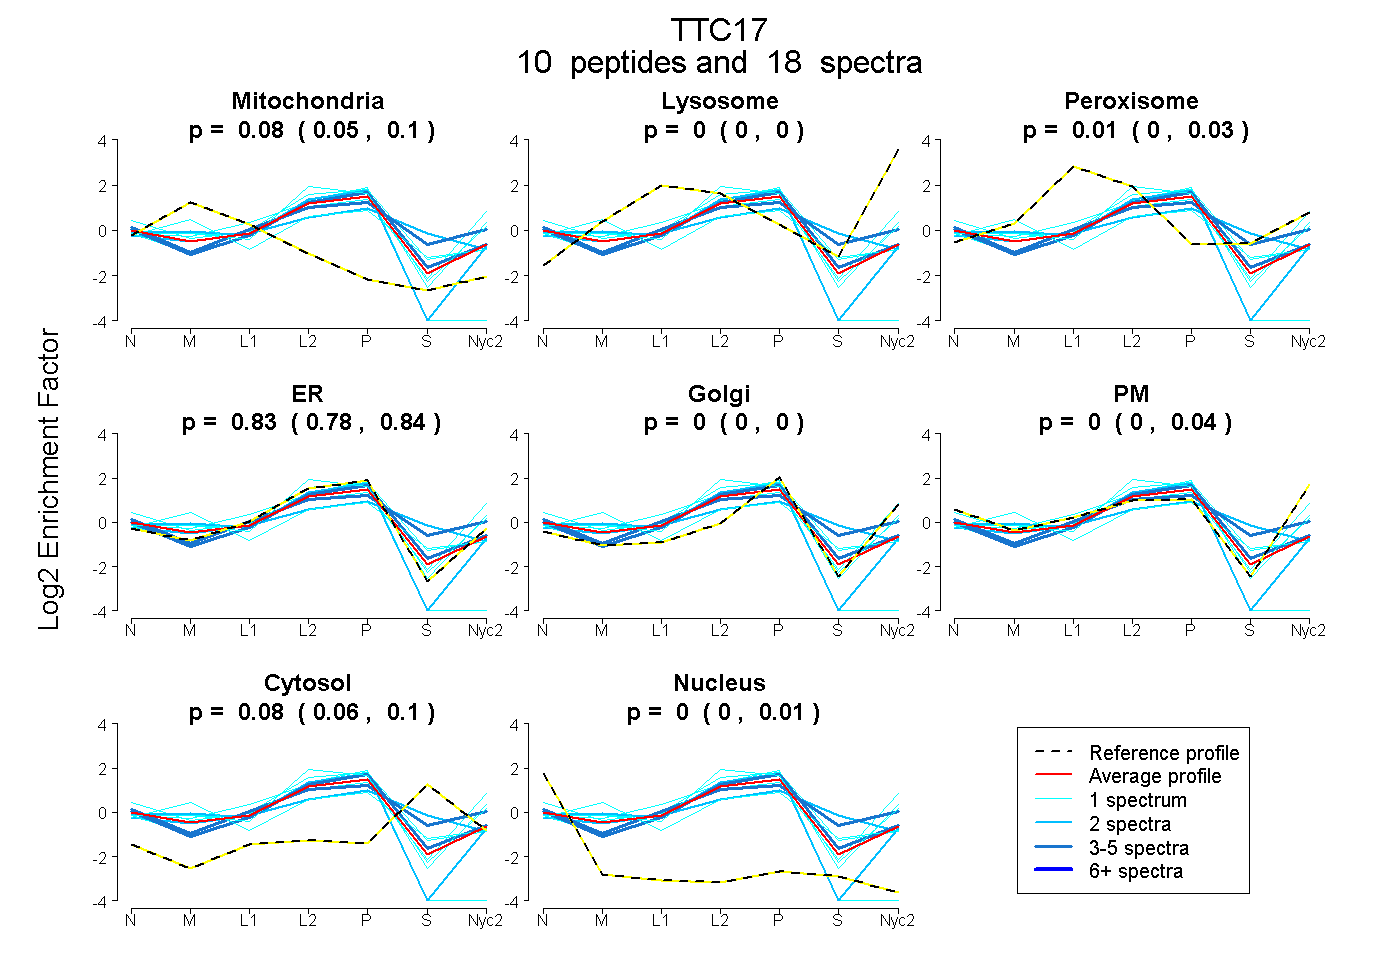
| Expt A |
10 peptides |
18 spectra |
|
0.078 0.049 | 0.097 |
0.000 0.000 | 0.000 |
0.011 0.000 | 0.030 |
0.826 0.783 | 0.840 |
0.000 0.000 | 0.000 |
0.000 0.000 | 0.041 |
0.085 0.058 | 0.105 |
0.000 0.000 | 0.009 |
||
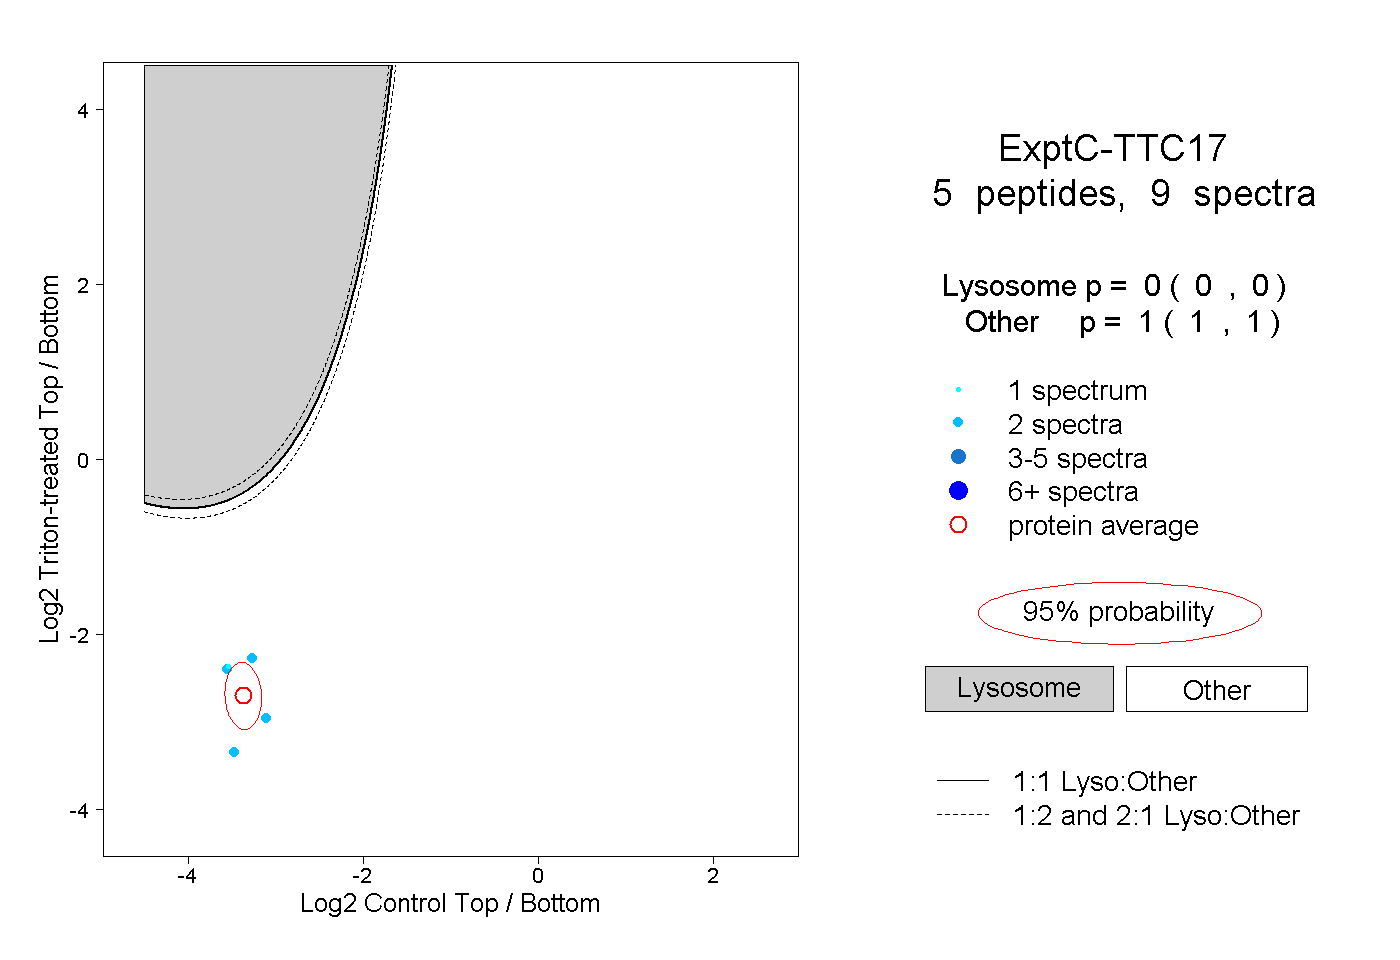
| Plot | Lyso | Other | |||||||||||
| Expt C |
5 peptides |
9 spectra |
|
0.000 0.000 | 0.000 |
1.000 1.000 | 1.000 |