 5
5peptides
spectra
0.000 | 0.000
0.000 | 0.125
0.011 | 0.208
0.014 | 0.241
0.295 | 0.642
0.021 | 0.243
0.000 | 0.099
0.000 | 0.000
| Plot | Mito | Lyso | Perox | ER | Golgi | PM | Cytosol | Nucleus | |||||
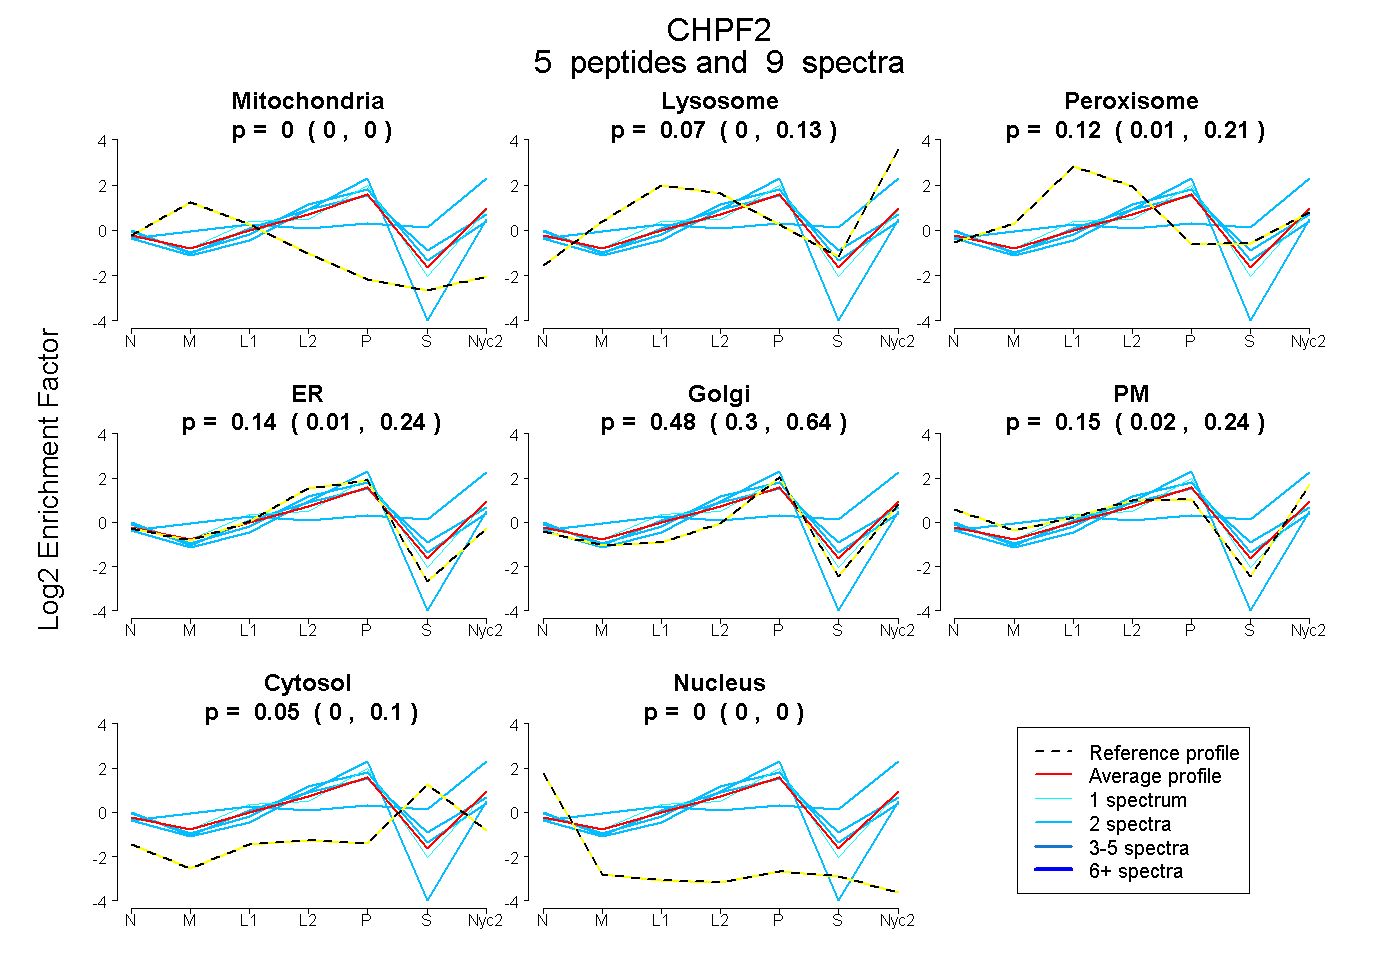
| Expt A |
5 peptides |
9 spectra |
|
0.000 0.000 | 0.000 |
0.066 0.000 | 0.125 |
0.117 0.011 | 0.208 |
0.142 0.014 | 0.241 |
0.480 0.295 | 0.642 |
0.146 0.021 | 0.243 |
0.048 0.000 | 0.099 |
0.000 0.000 | 0.000 |
| 2 spectra, ADVGDAVDTALEQLNR | 0.000 | 0.034 | 0.133 | 0.251 | 0.245 | 0.188 | 0.148 | 0.000 | ||
| 2 spectra, LSNLEGLGAR | 0.000 | 0.466 | 0.000 | 0.000 | 0.000 | 0.229 | 0.304 | 0.000 | ||
| 2 spectra, LLYFTGQR | 0.000 | 0.000 | 0.000 | 0.556 | 0.444 | 0.000 | 0.000 | 0.000 | ||
| 2 spectra, AEAPSQVR | 0.000 | 0.054 | 0.000 | 0.554 | 0.104 | 0.157 | 0.130 | 0.000 | ||
| 1 spectrum, FSGLHLFR | 0.000 | 0.069 | 0.124 | 0.179 | 0.587 | 0.040 | 0.000 | 0.000 |
| Plot | Lyso | Other | |||||||||||
| Expt C |
1 peptide |
2 spectra |
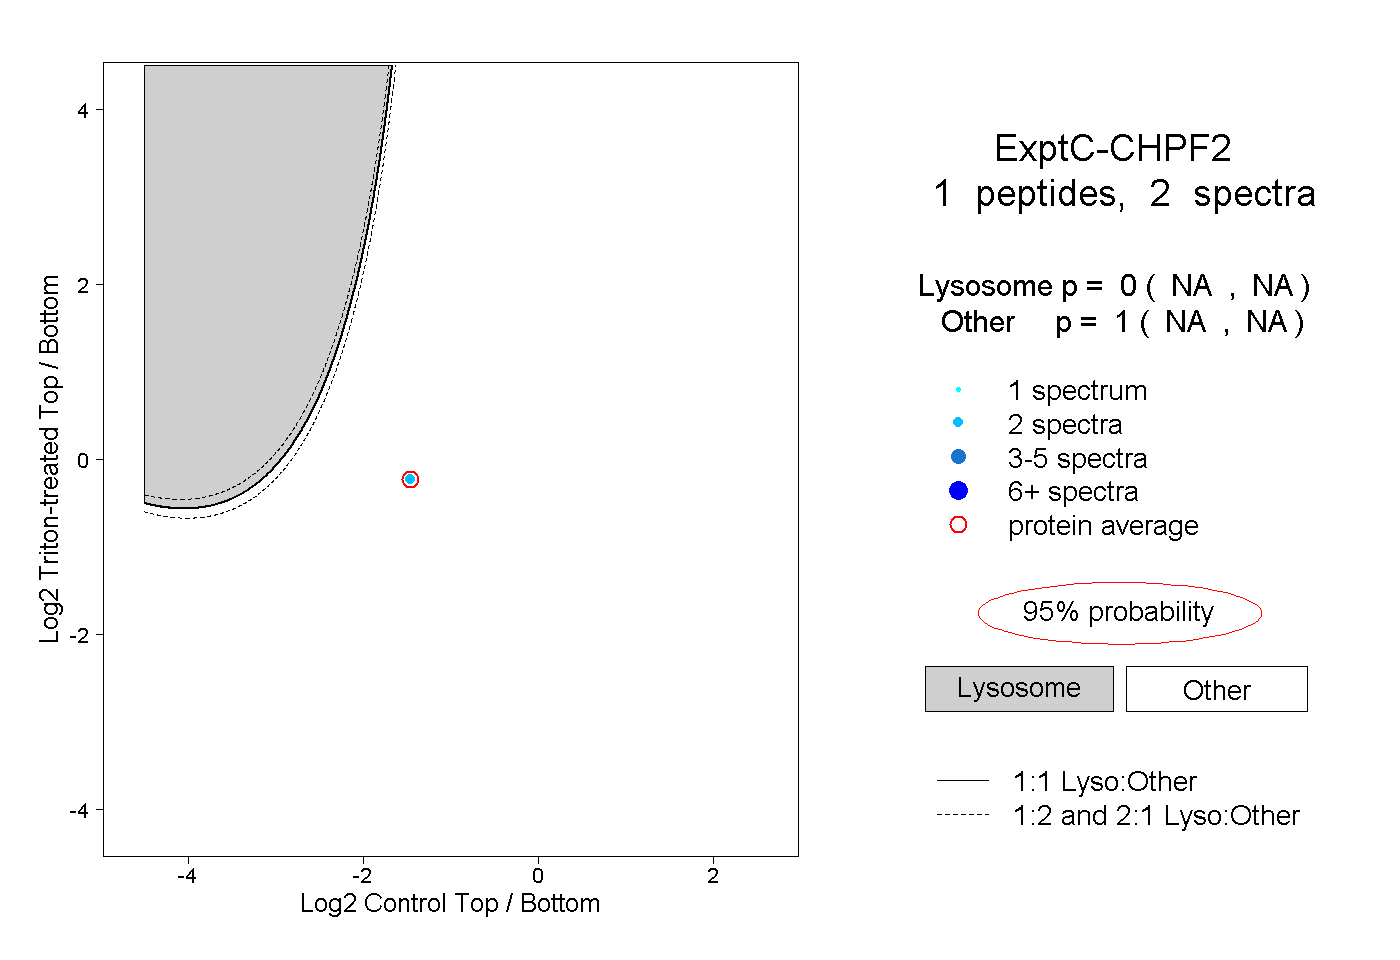 |
0.000 NA | NA |
1.000 NA | NA |
||||||||
| Plot | Lyso | Other | |||||||||||
| Expt D |
1 peptide |
2 spectra |
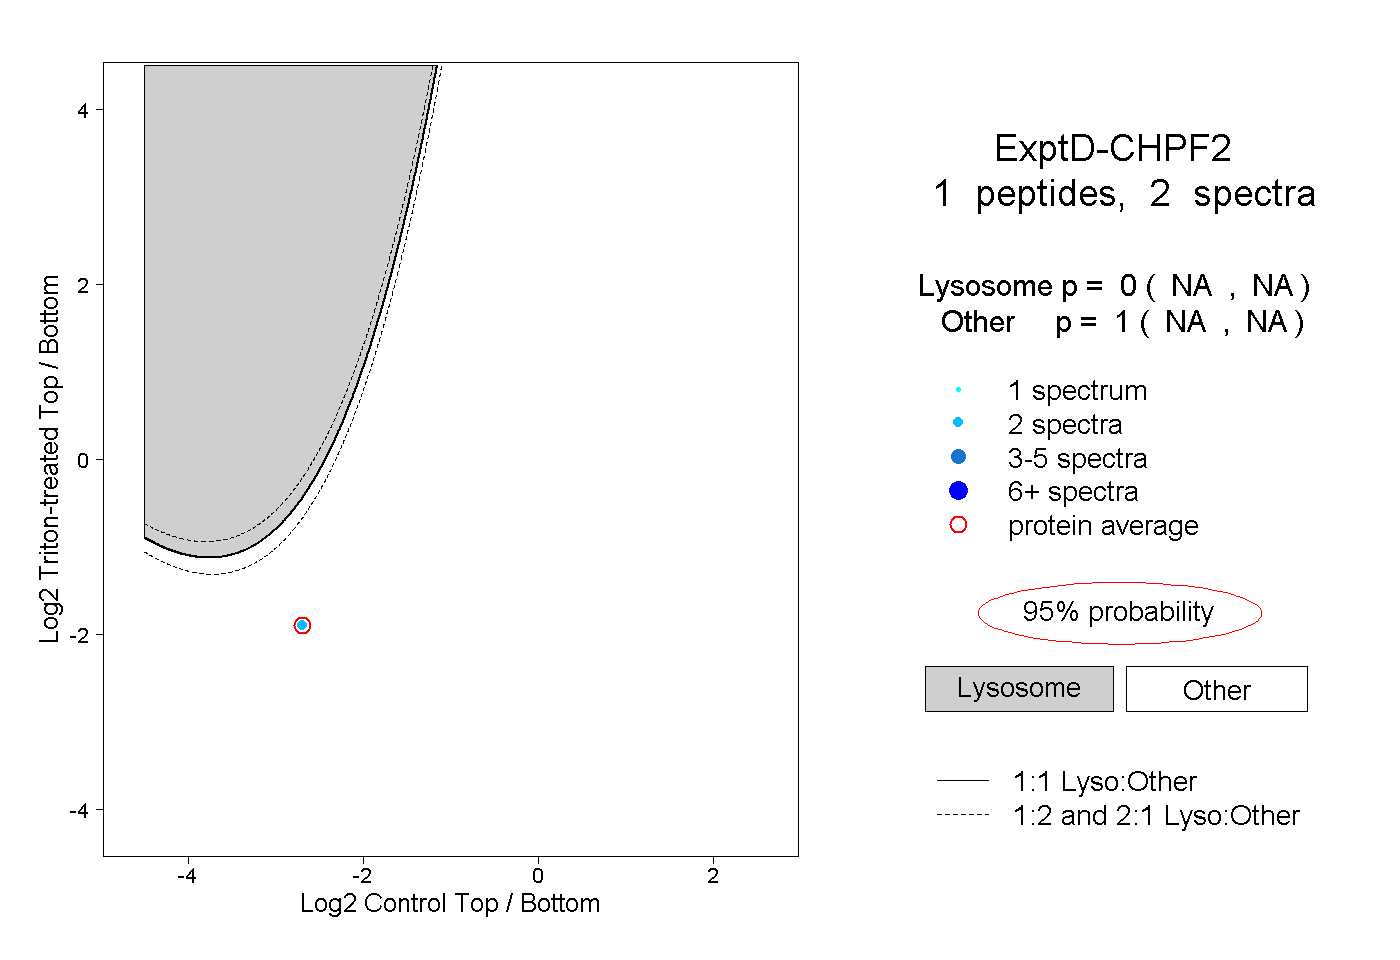 |
0.000 NA | NA |
1.000 NA | NA |