10
10peptides
spectra
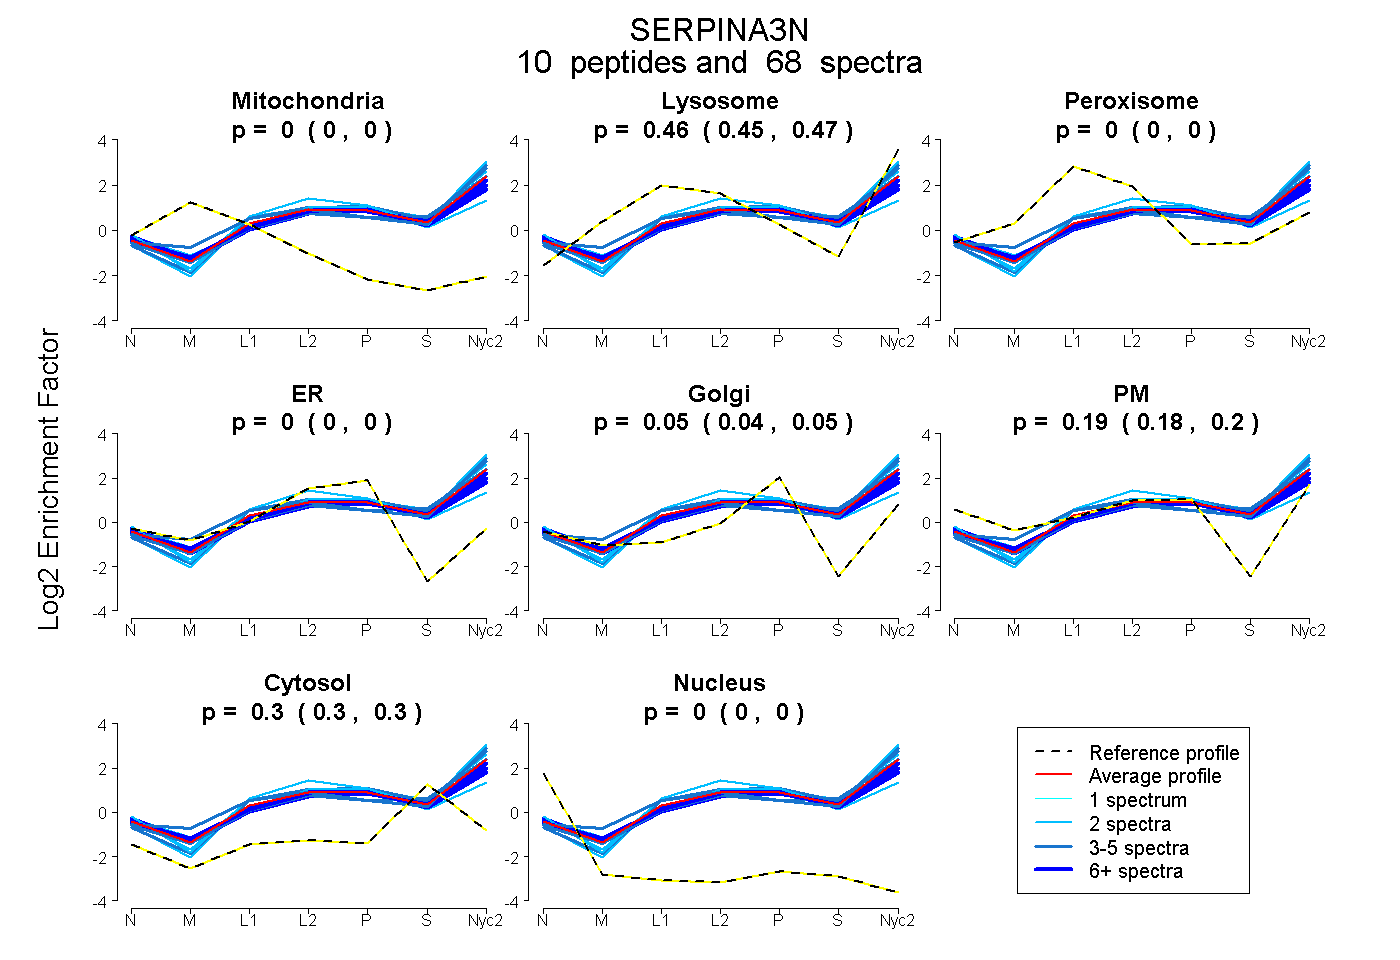
0.000 | 0.000
0.454 | 0.465
0.000 | 0.000
0.000 | 0.000
0.039 | 0.052
0.184 | 0.200
0.297 | 0.304
0.000 | 0.000
5peptides
spectra
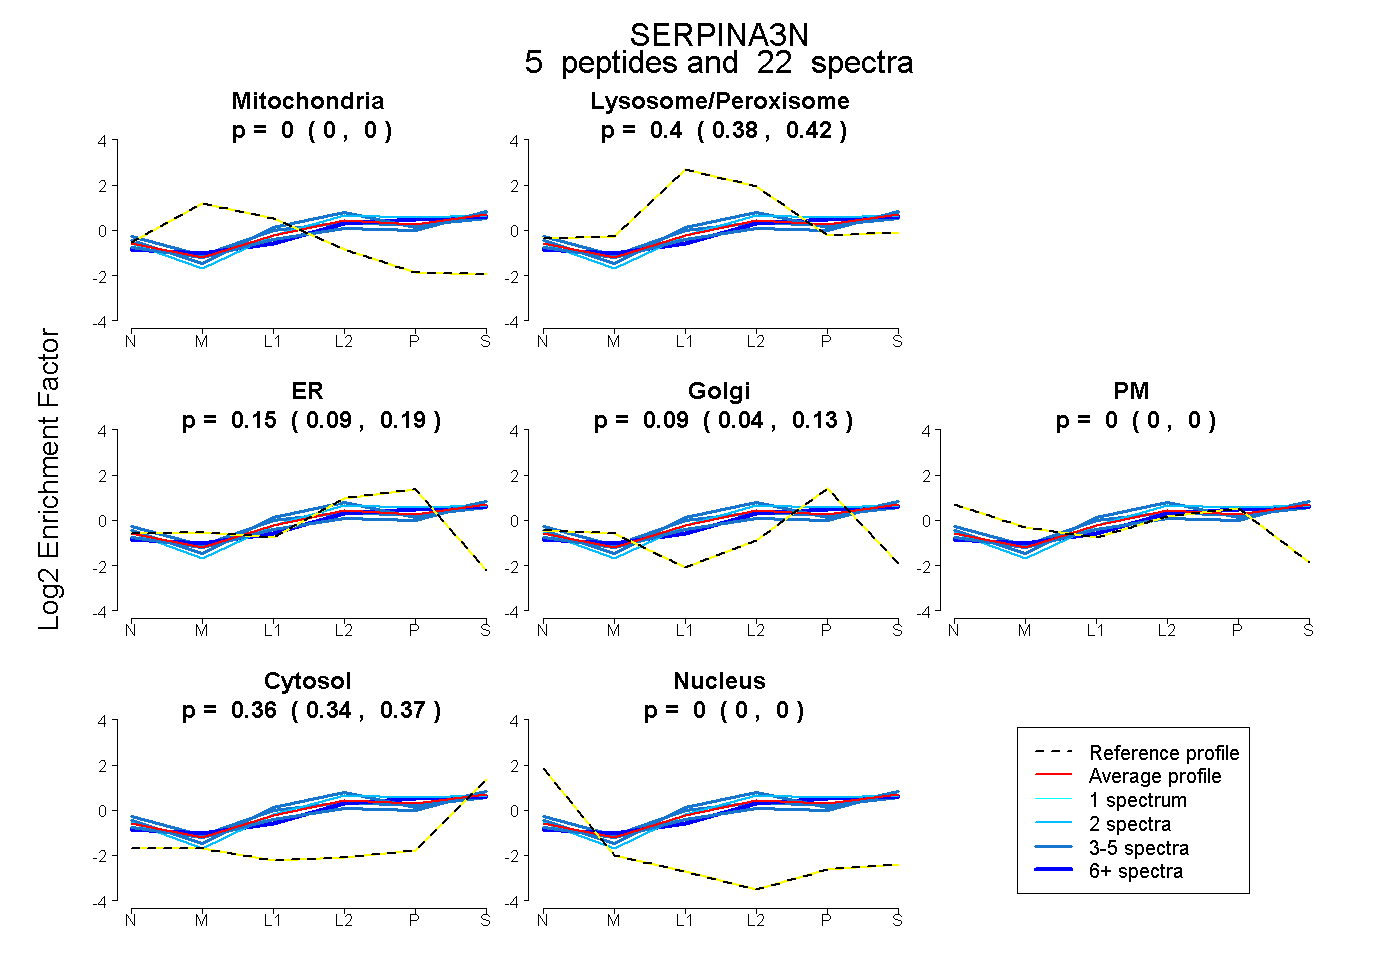
0.000 | 0.000
0.382 | 0.420
0.094 | 0.194
0.043 | 0.130
0.000 | 0.000
0.343 | 0.370
0.000 | 0.000
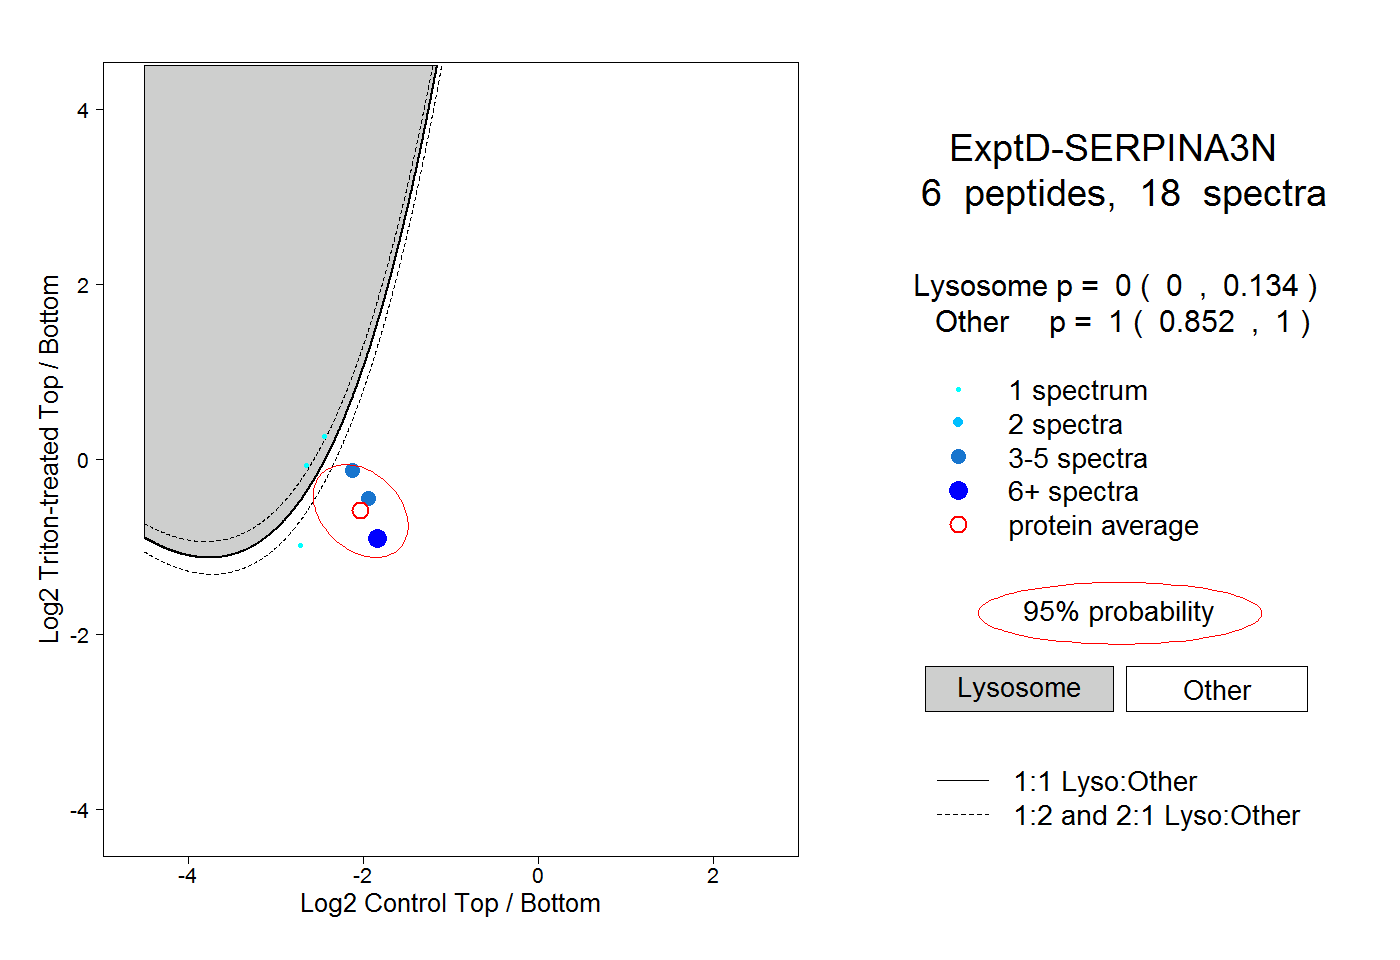
16peptides
spectra
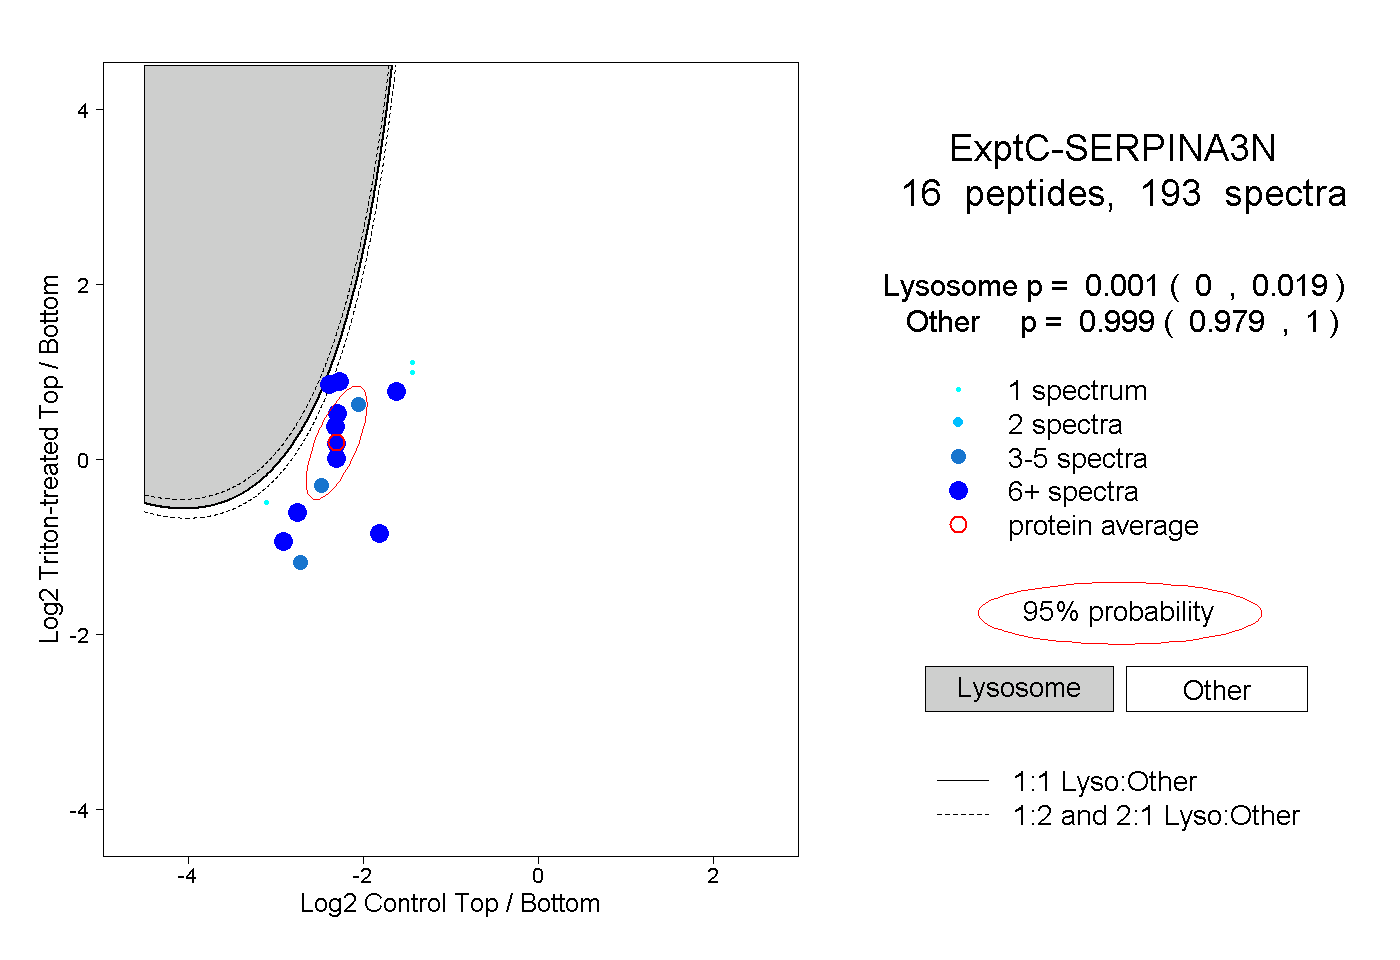
0.000 | 0.019
0.979 | 1.000