 22
22peptides
spectra
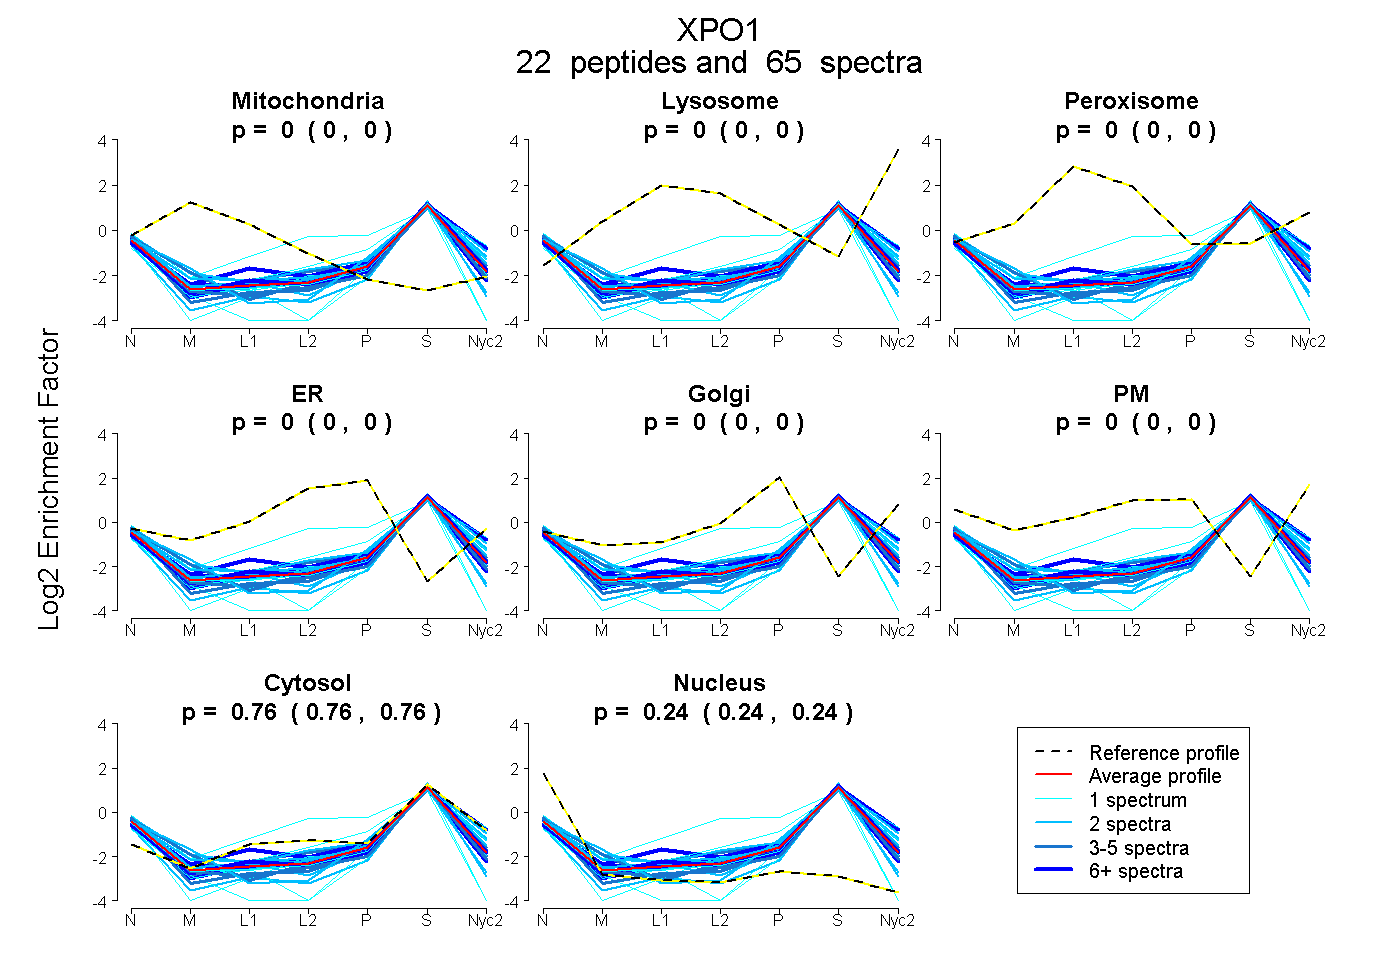
0.000 | 0.000
0.000 | 0.000
0.000 | 0.000
0.000 | 0.000
0.000 | 0.000
0.000 | 0.000
0.757 | 0.762
0.237 | 0.243
6peptides
spectra
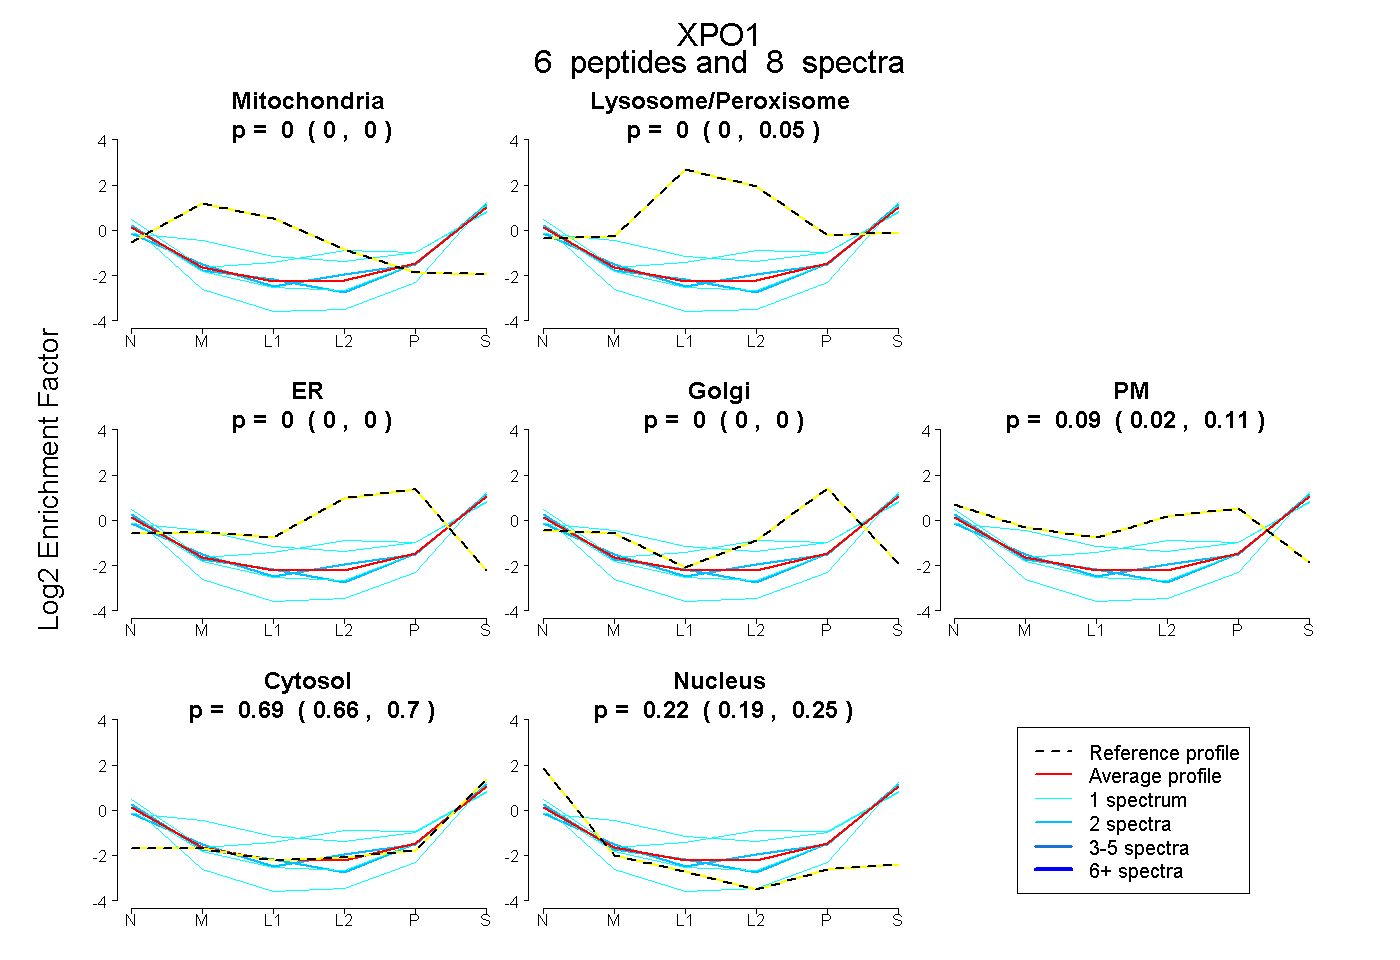
0.000 | 0.000
0.000 | 0.050
0.000 | 0.000
0.000 | 0.000
0.023 | 0.111
0.664 | 0.704
0.191 | 0.249
12peptides
spectra
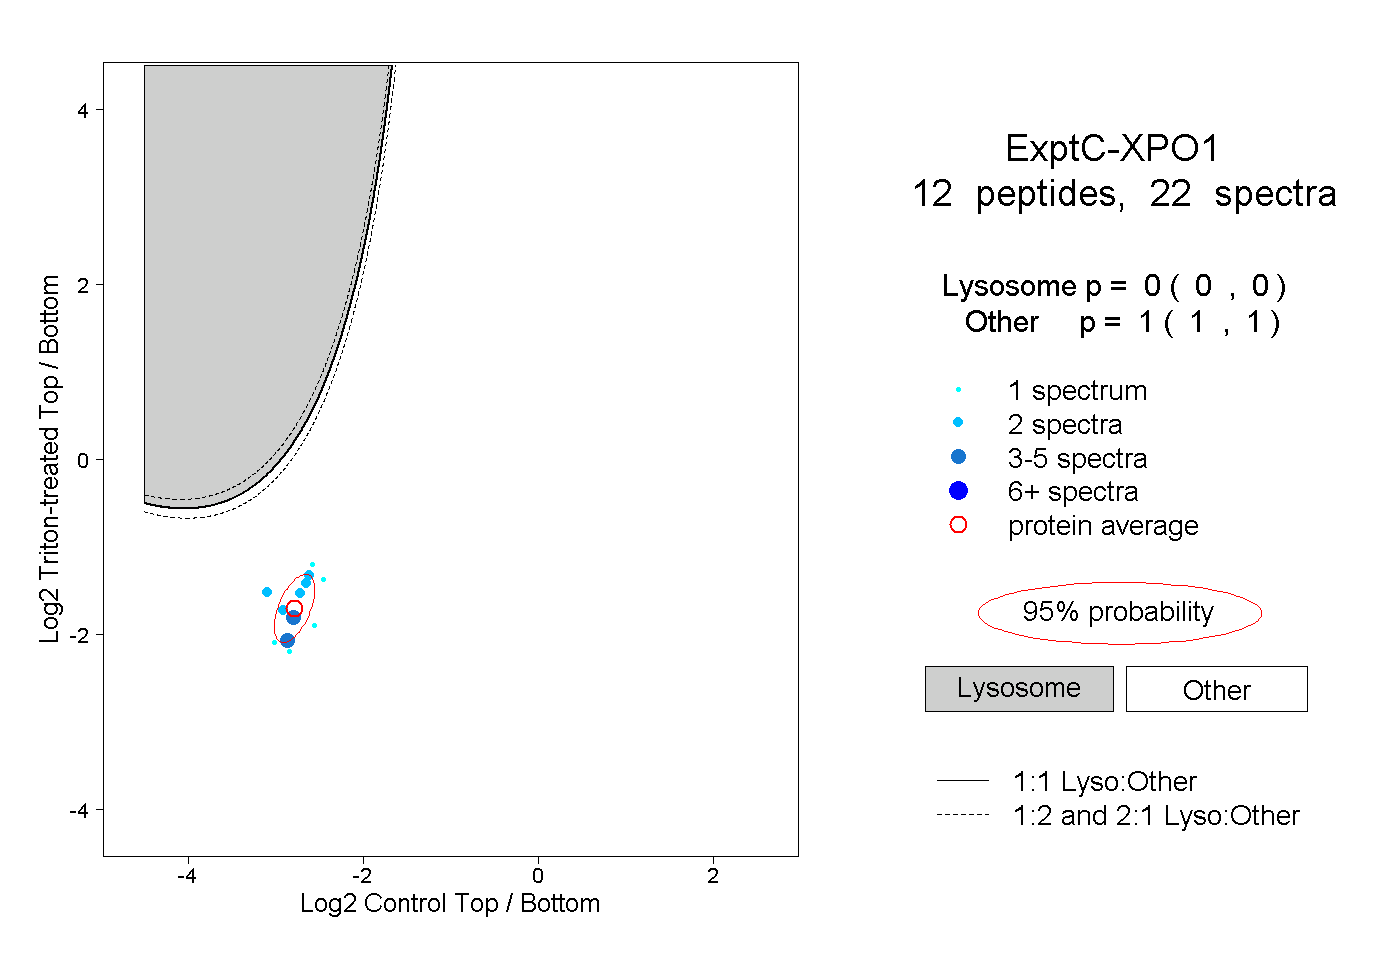
0.000 | 0.000
1.000 | 1.000