 6
6peptides
spectra
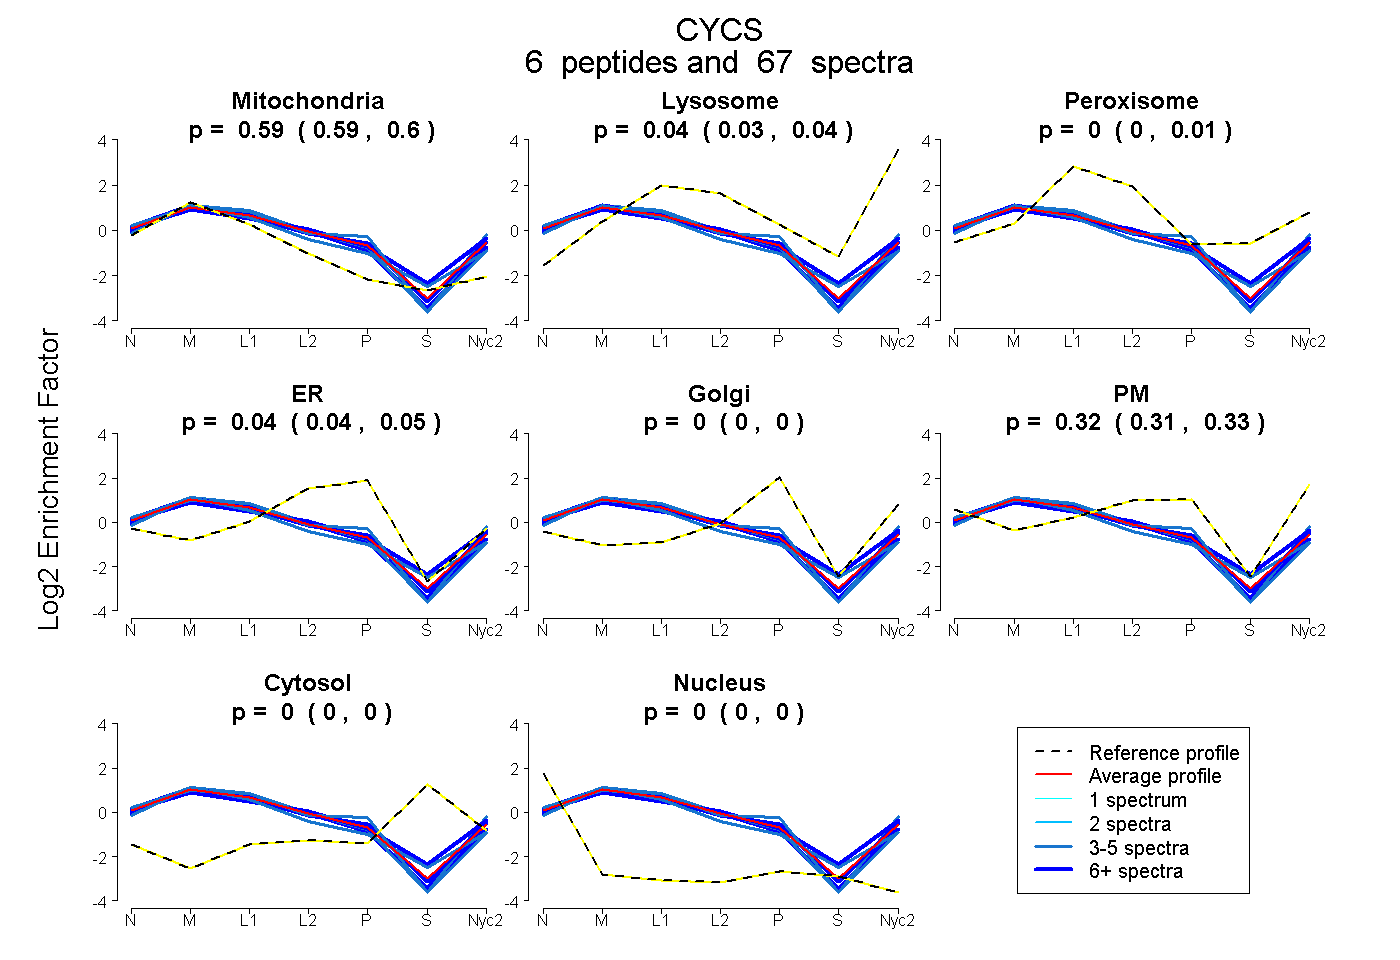
0.590 | 0.597
0.028 | 0.040
0.000 | 0.014
0.035 | 0.049
0.000 | 0.000
0.314 | 0.332
0.000 | 0.000
0.000 | 0.000
7peptides
spectra
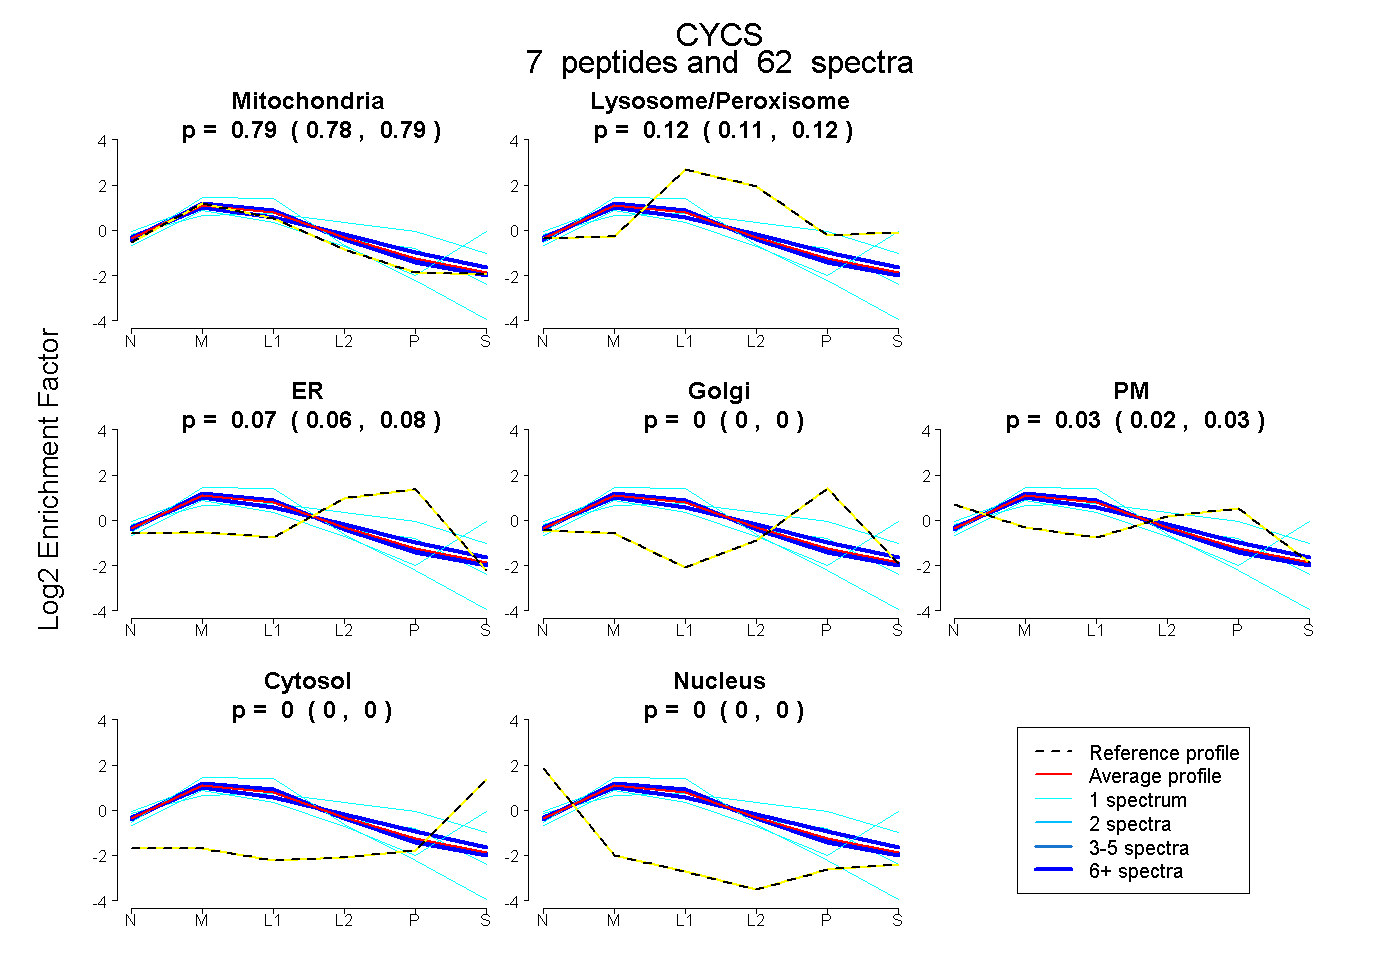
0.779 | 0.794
0.112 | 0.123
0.057 | 0.079
0.000 | 0.000
0.017 | 0.033
0.000 | 0.000
0.000 | 0.000
9peptides
spectra
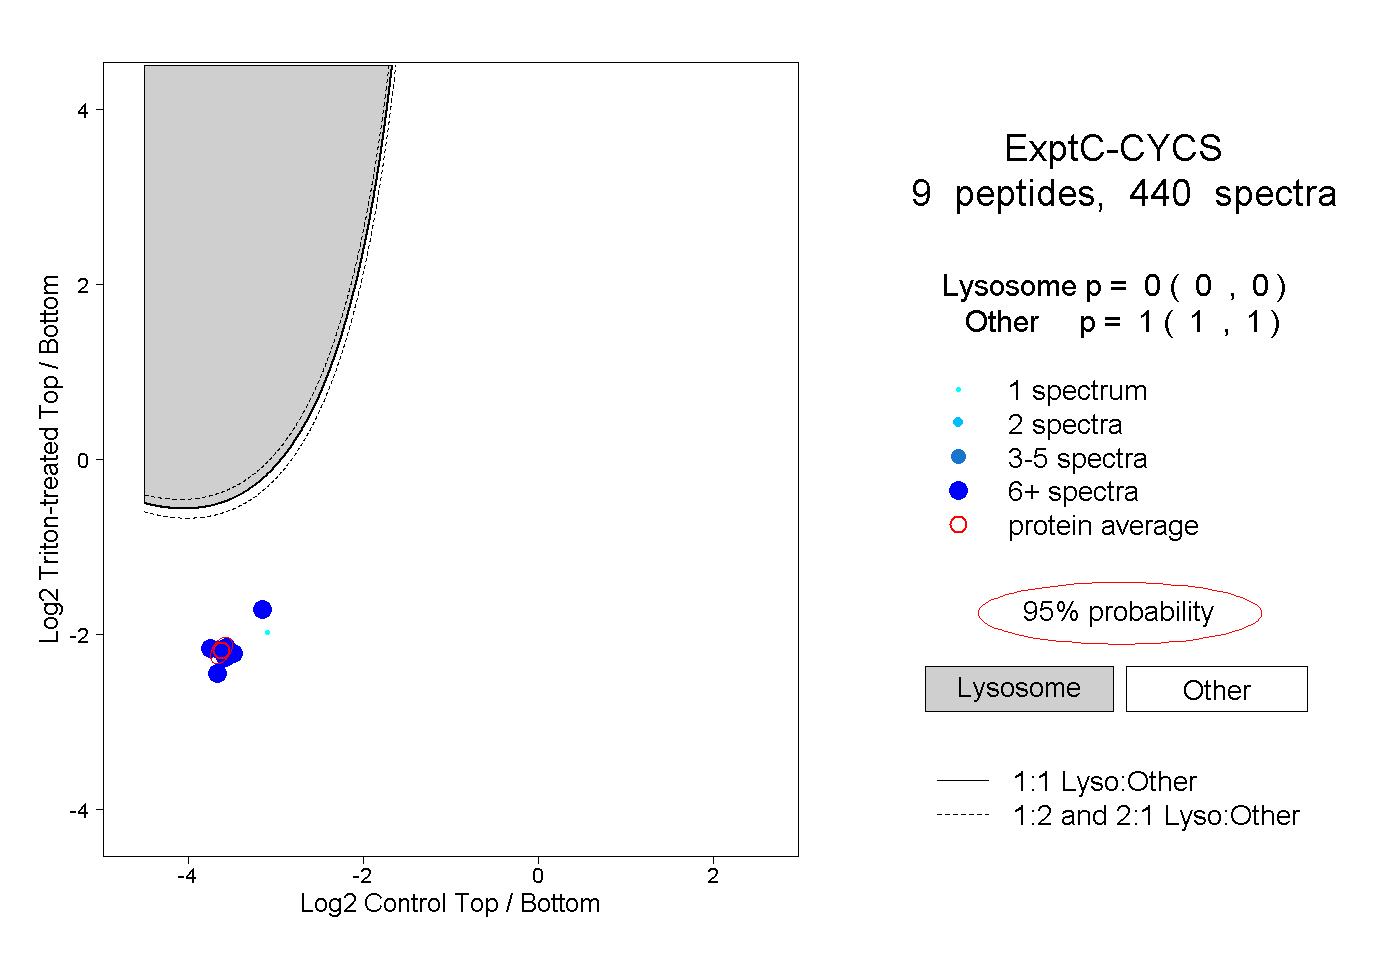
0.000 | 0.000
1.000 | 1.000
6peptides
spectra
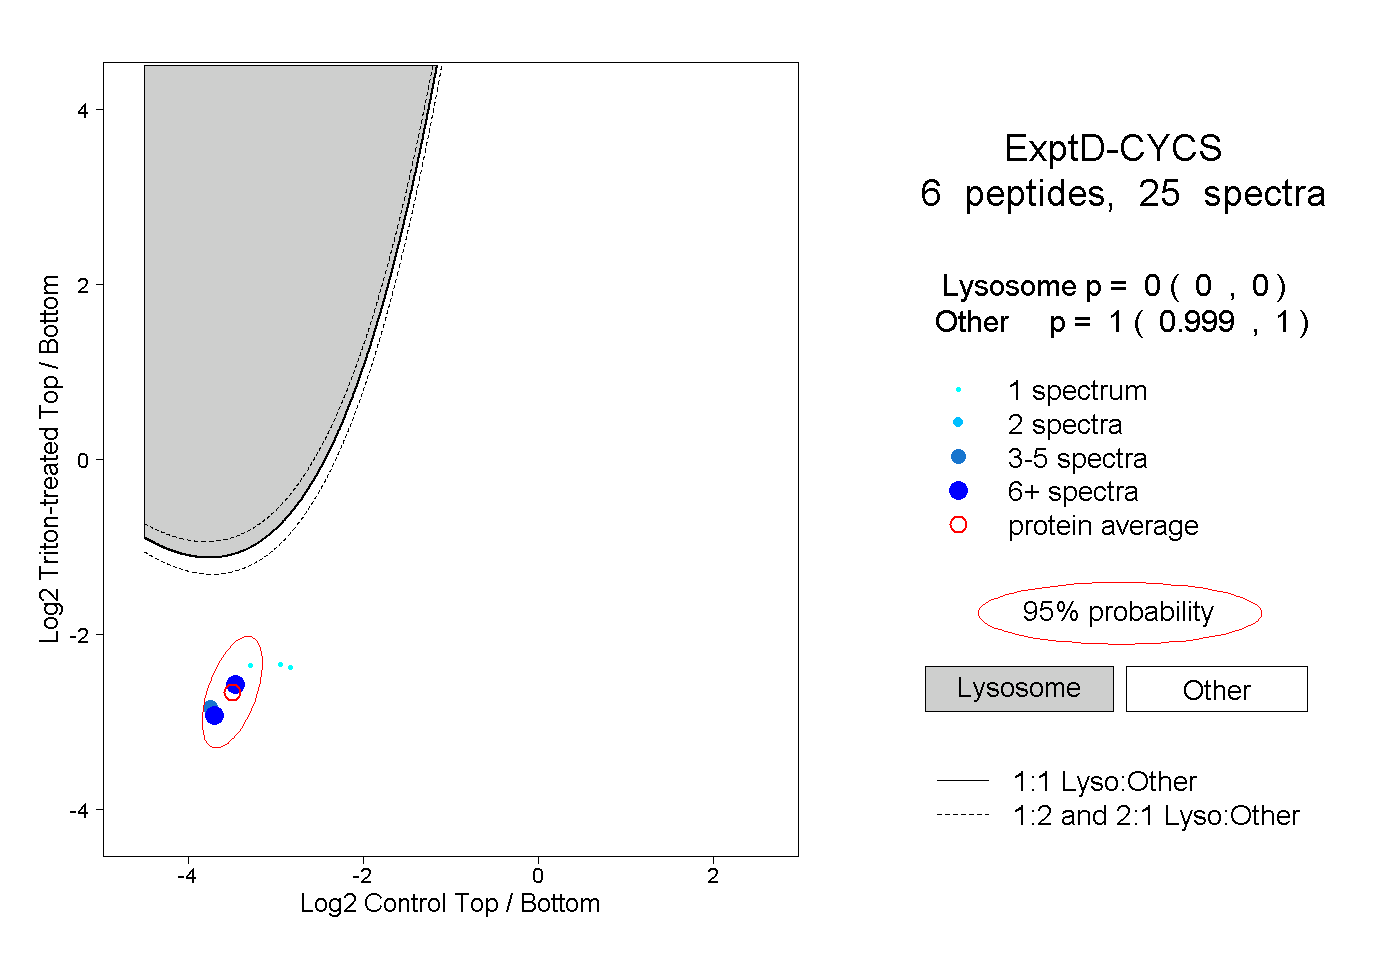
0.000 | 0.000
0.999 | 1.000