18
18peptides
spectra
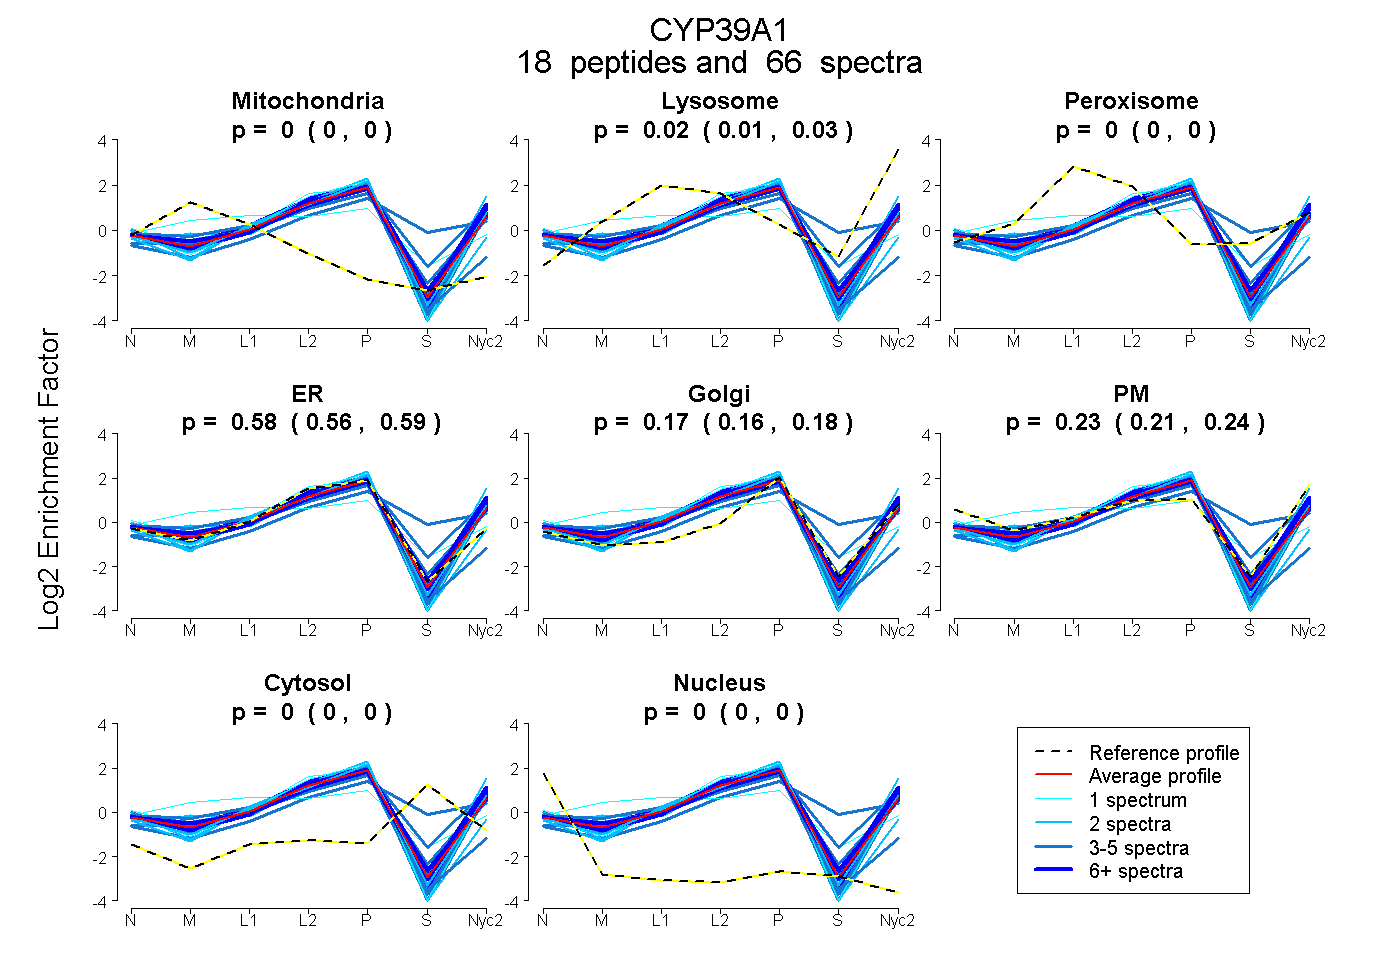
0.000 | 0.000
0.014 | 0.029
0.000 | 0.000
0.565 | 0.588
0.164 | 0.181
0.213 | 0.239
0.000 | 0.000
0.000 | 0.000
13peptides
spectra
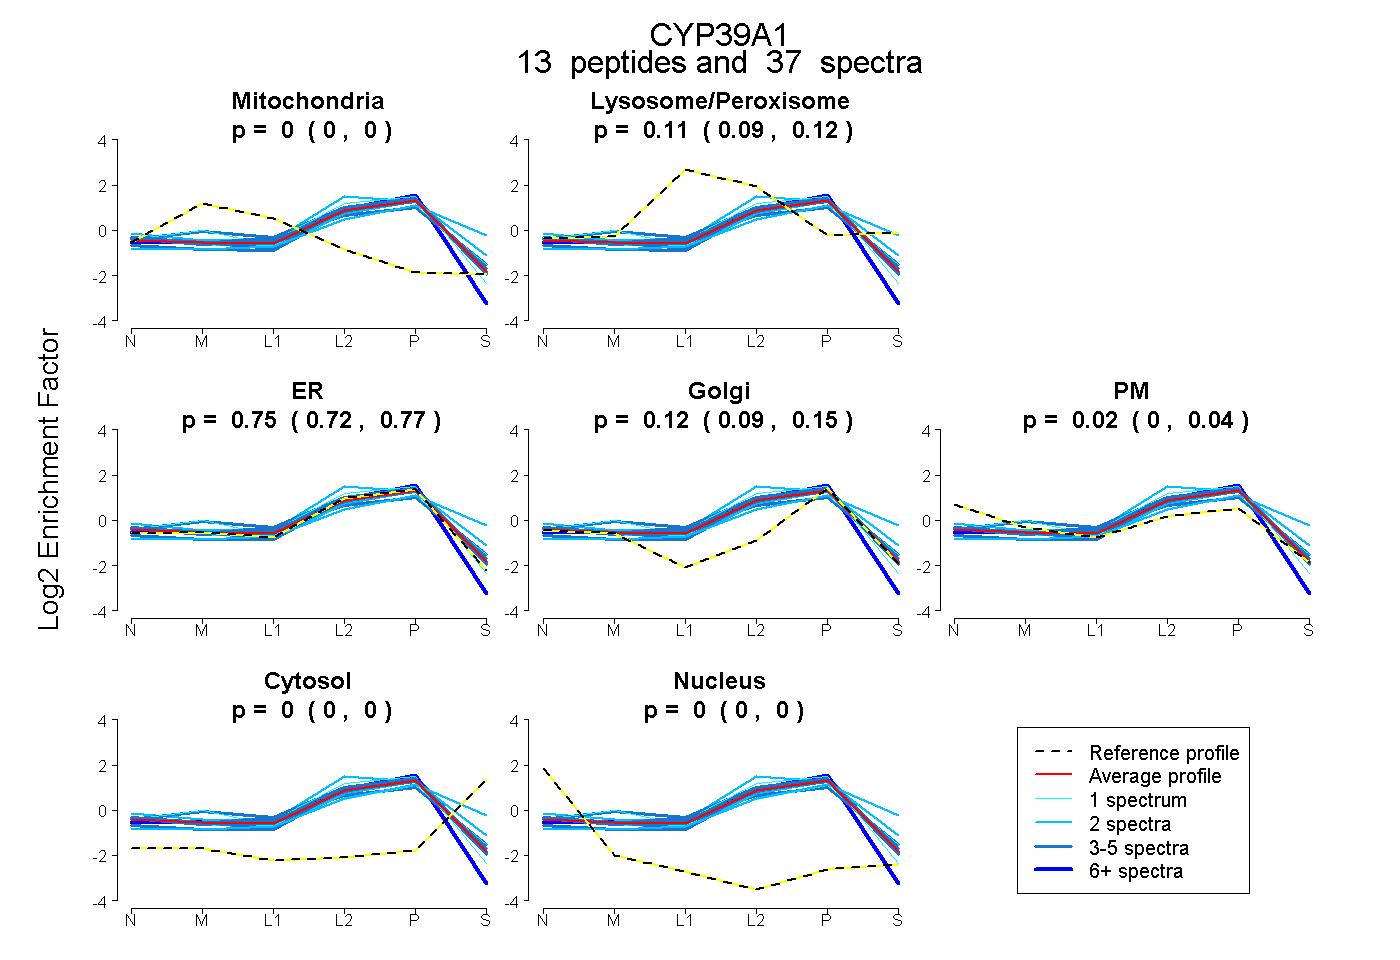
0.000 | 0.000
0.089 | 0.121
0.718 | 0.774
0.093 | 0.149
0.001 | 0.036
0.000 | 0.000
0.000 | 0.000