 17
17peptides
spectra
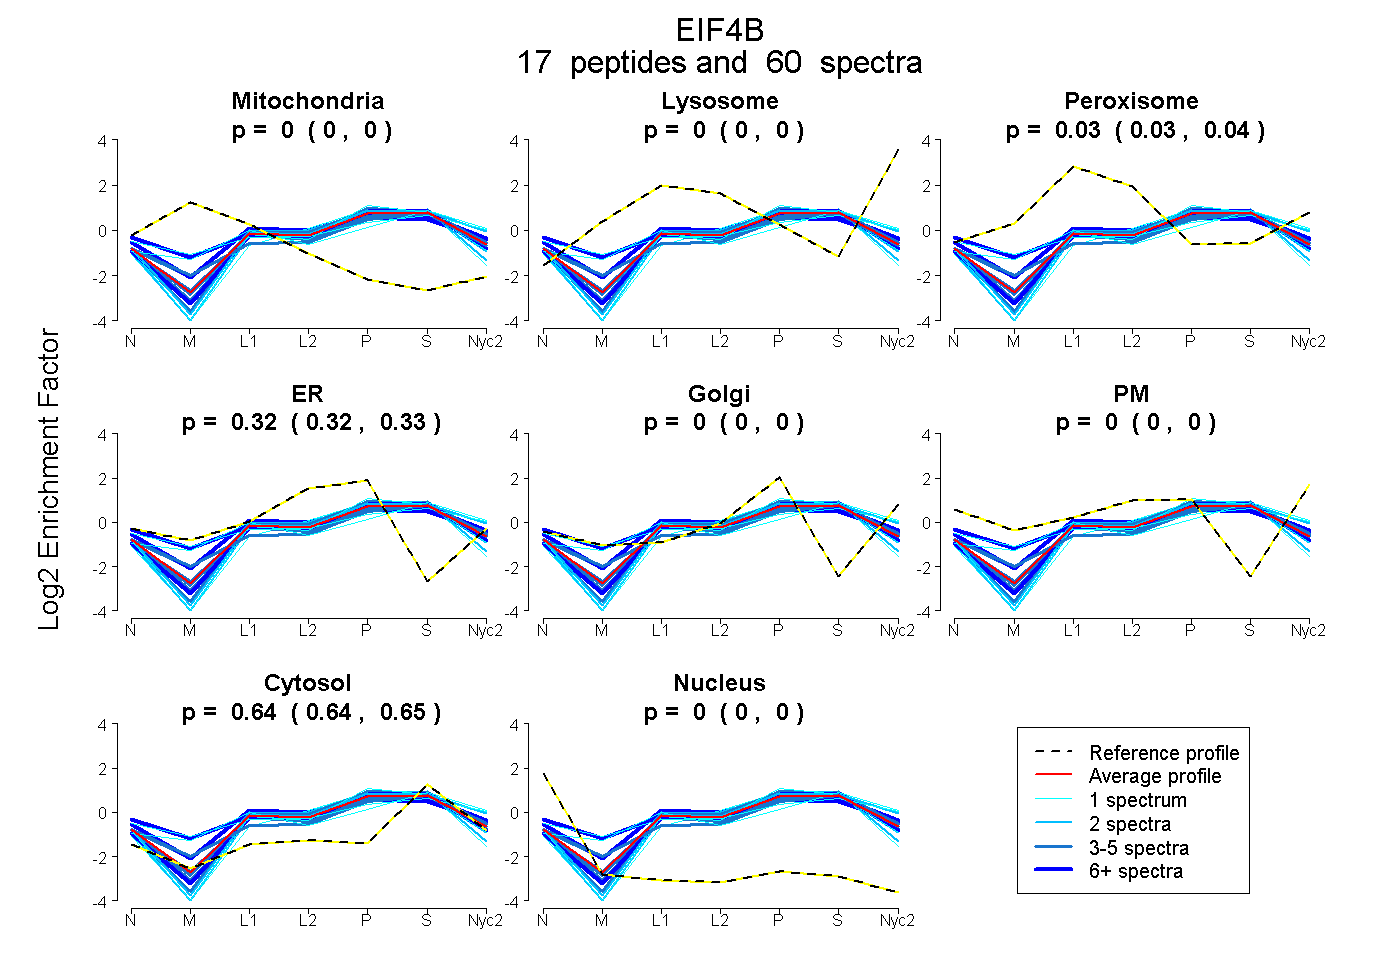
0.000 | 0.000
0.000 | 0.000
0.028 | 0.037
0.321 | 0.326
0.000 | 0.000
0.000 | 0.000
0.640 | 0.647
0.000 | 0.000
9peptides
spectra
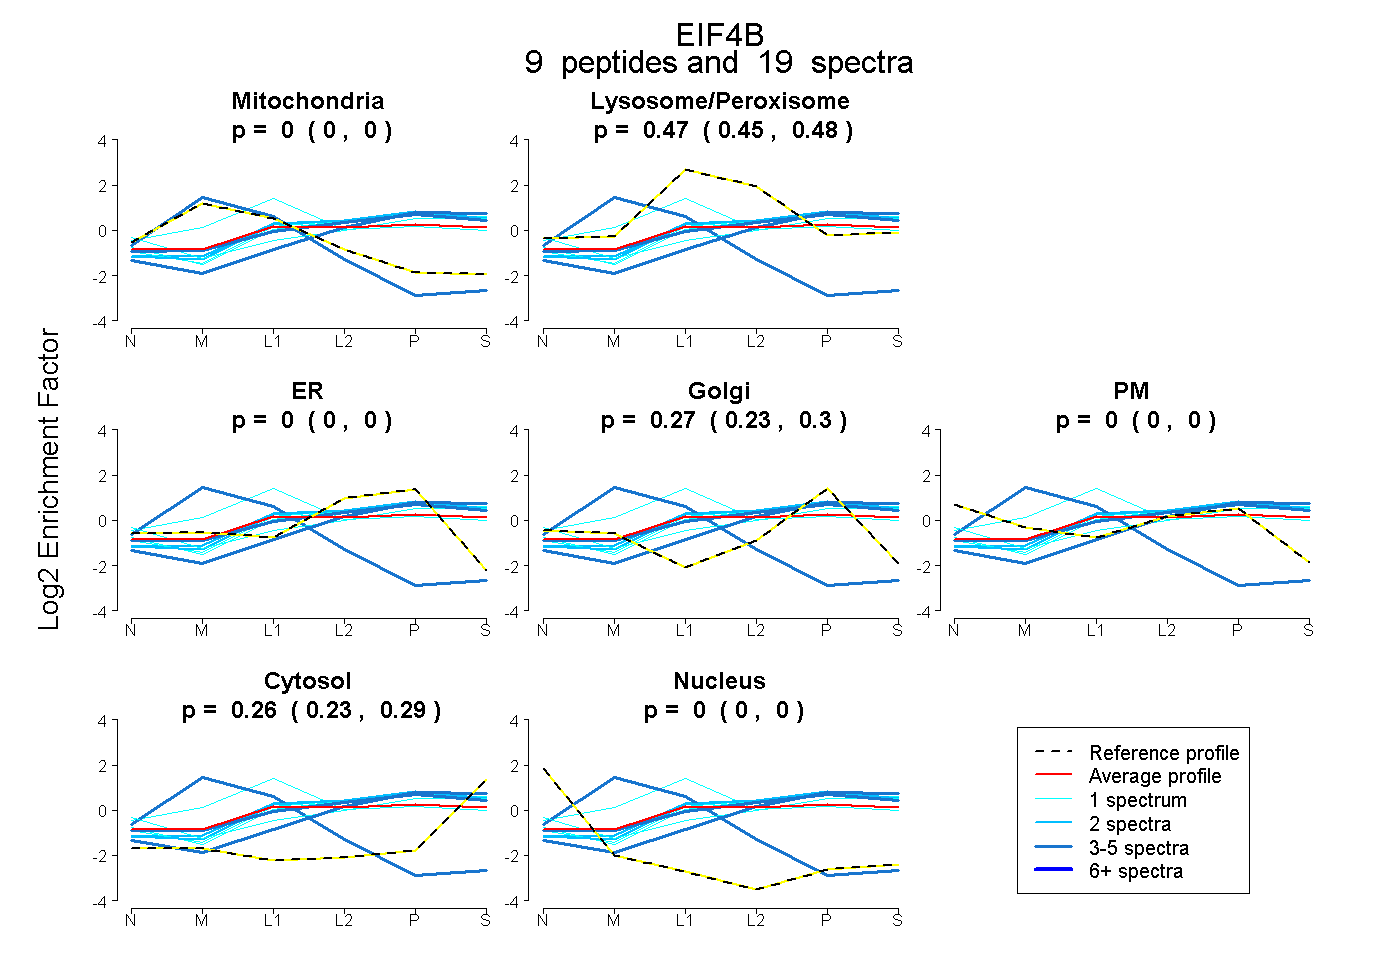
0.000 | 0.000
0.450 | 0.481
0.000 | 0.000
0.228 | 0.301
0.000 | 0.000
0.232 | 0.291
0.000 | 0.000
8peptides
spectra
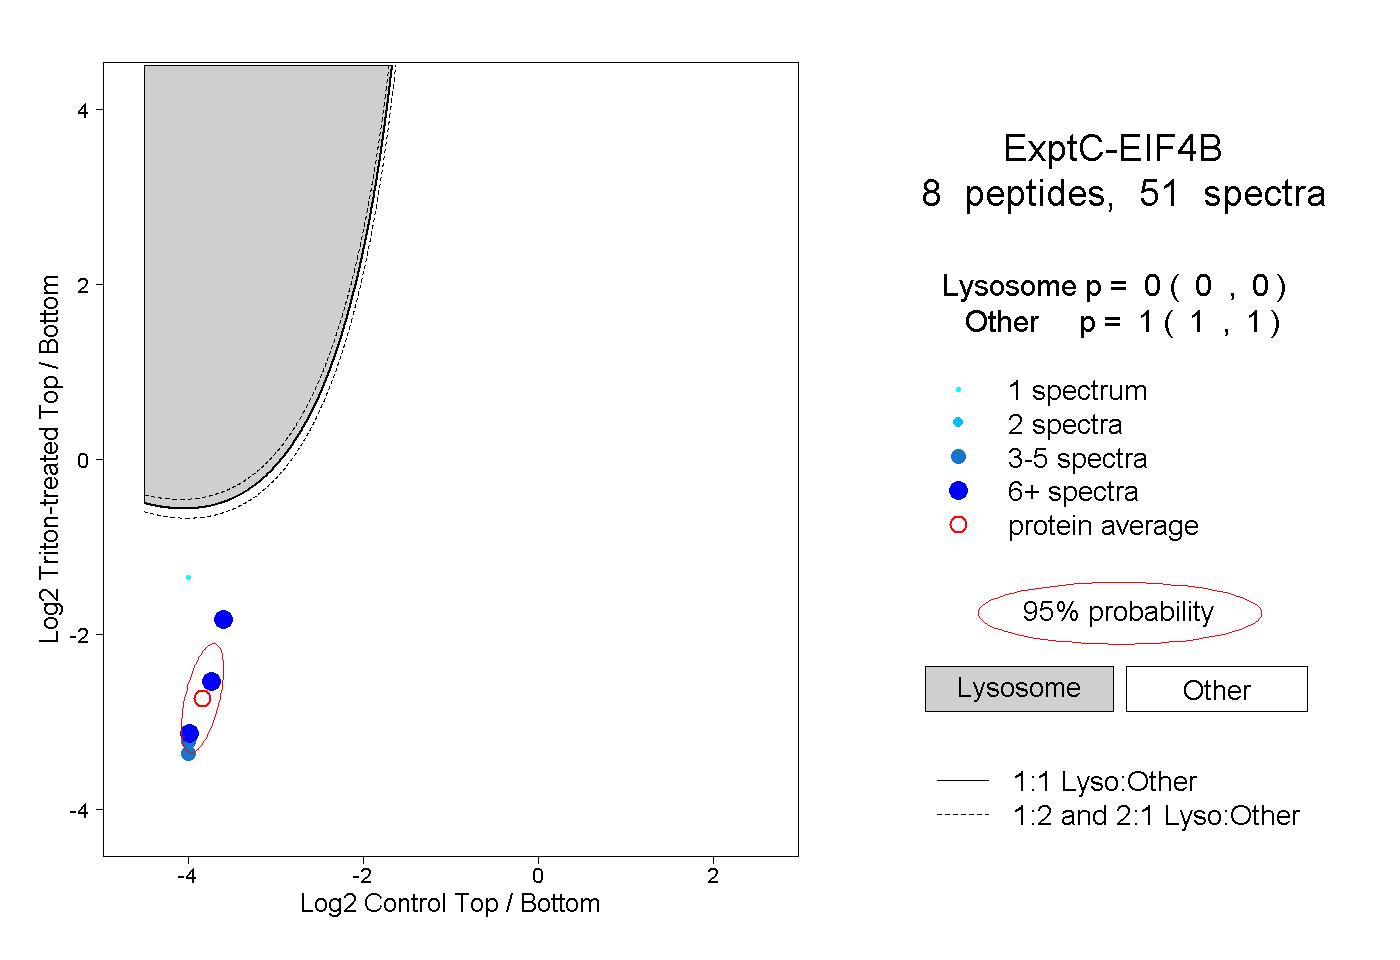
0.000 | 0.000
1.000 | 1.000
3peptides
spectra
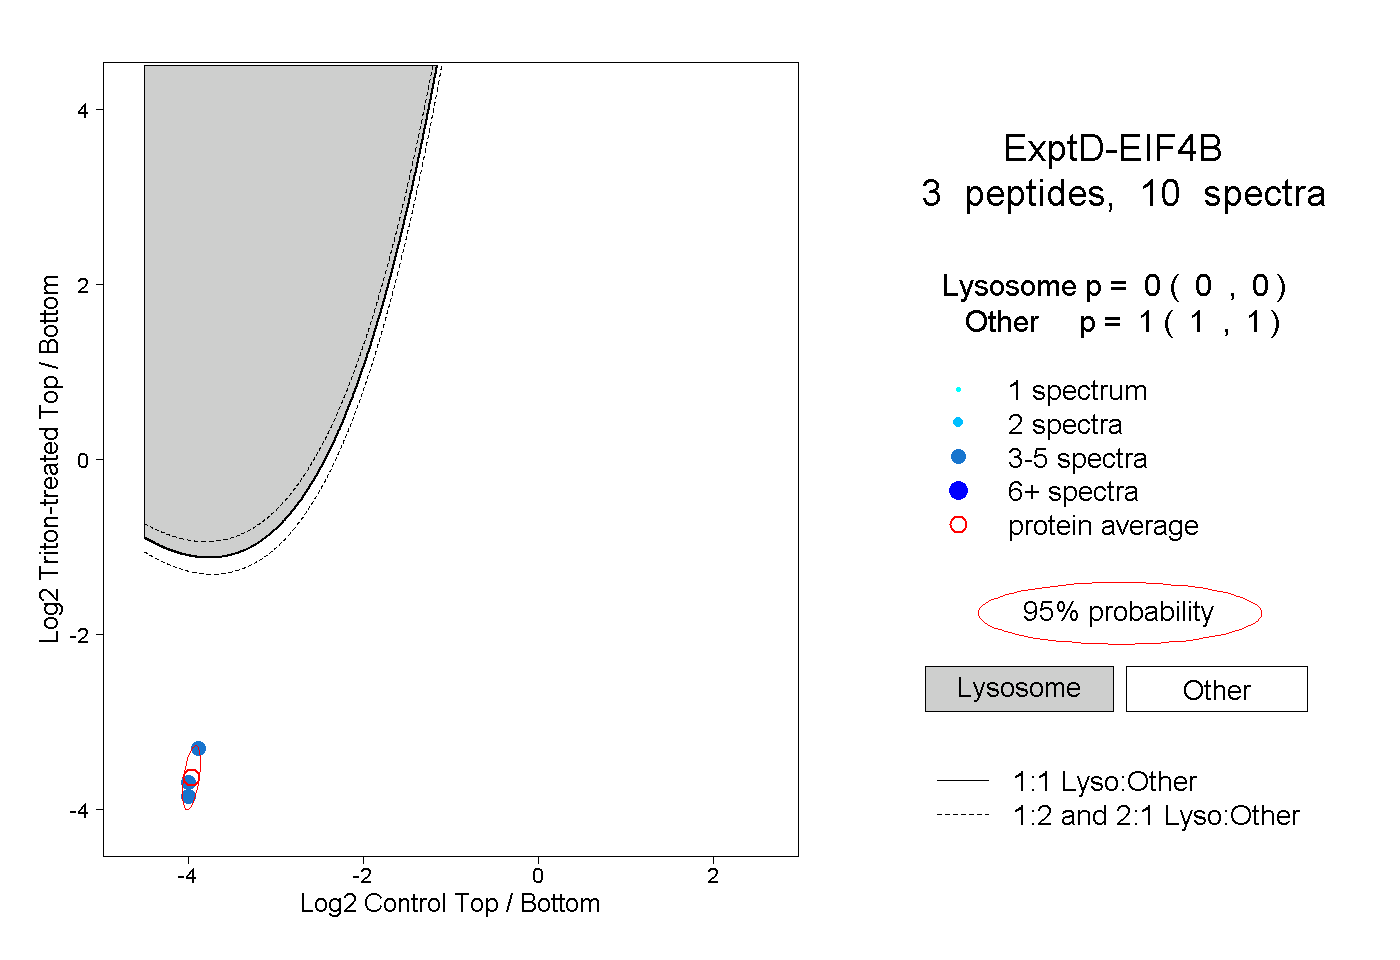
0.000 | 0.000
1.000 | 1.000