 2
2peptides
spectra
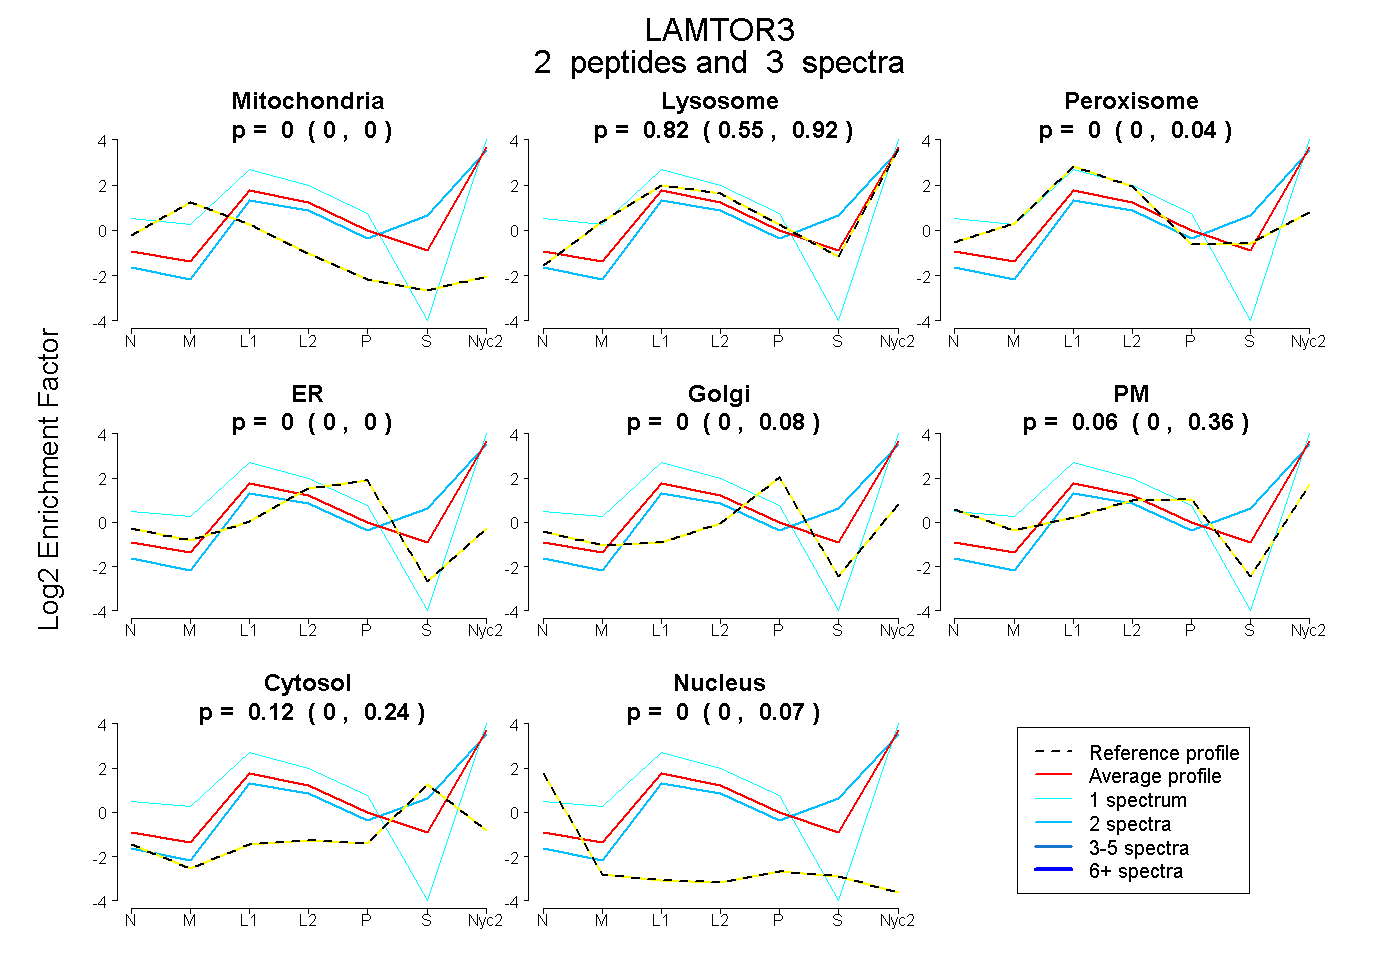
0.000 | 0.000
0.546 | 0.920
0.000 | 0.037
0.000 | 0.000
0.000 | 0.082
0.000 | 0.362
0.000 | 0.238
0.000 | 0.072
1peptide
spectra
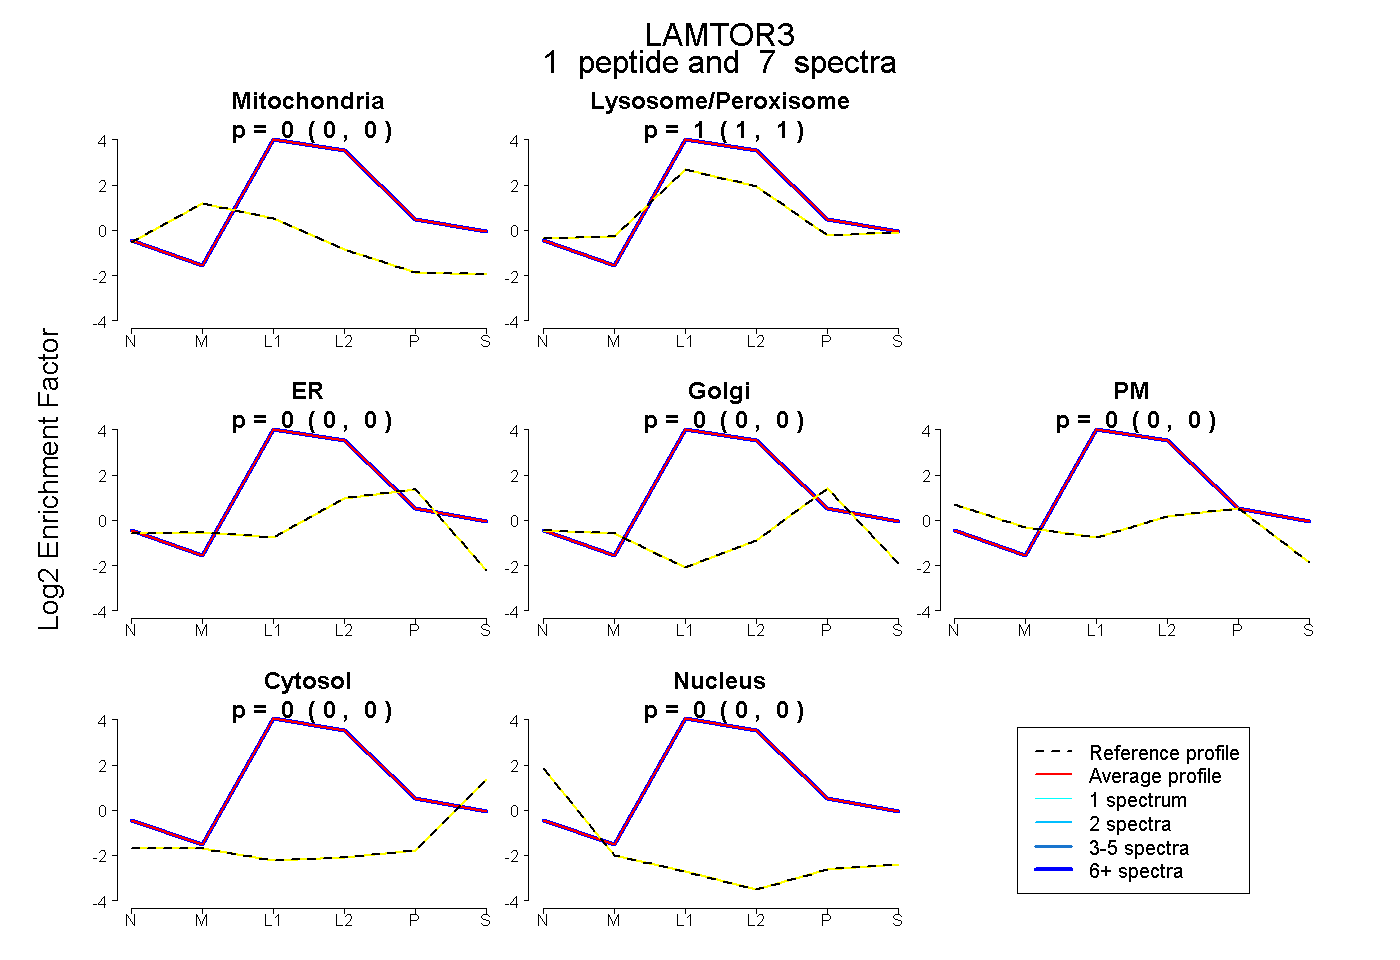
0.000 | 0.000
1.000 | 1.000
0.000 | 0.000
0.000 | 0.000
0.000 | 0.000
0.000 | 0.000
0.000 | 0.000
5peptides
spectra
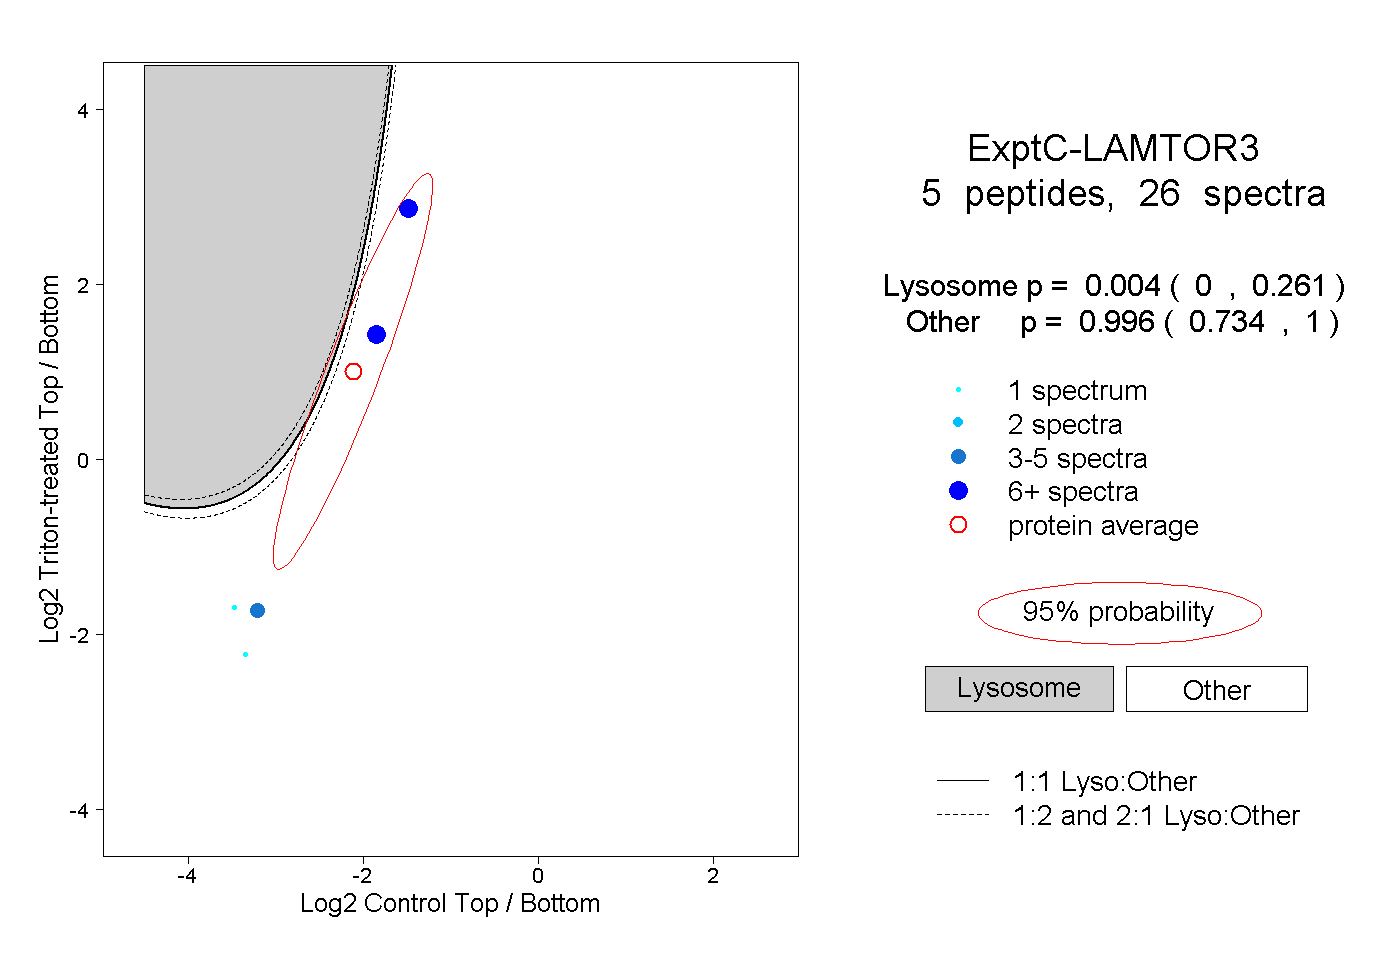
0.000 | 0.261
0.734 | 1.000
2peptides
spectra
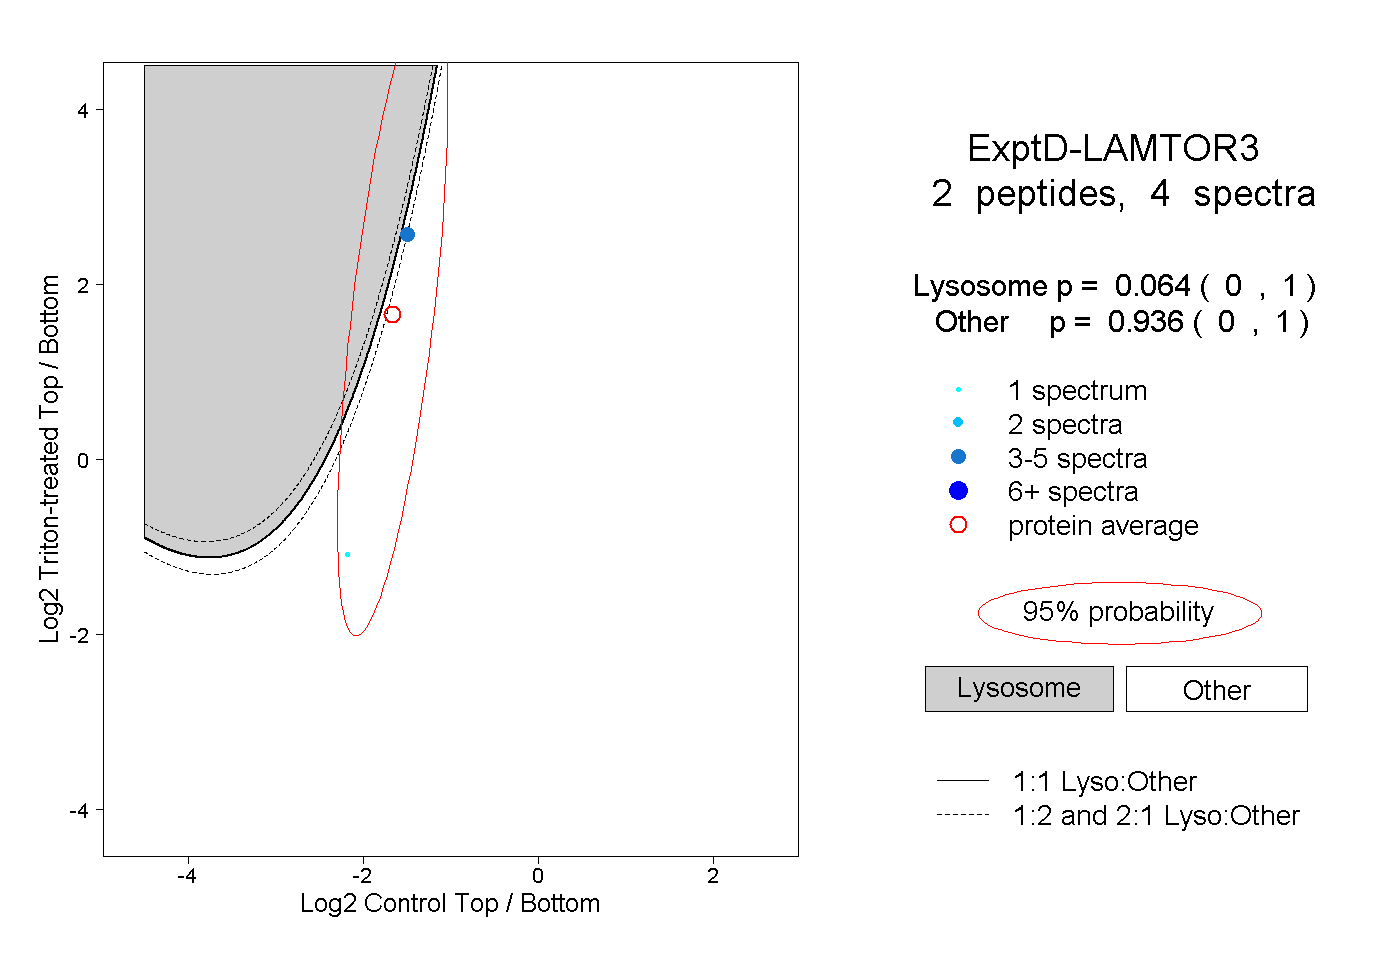
0.000 | 1.000
0.000 | 1.000