 16
16peptides
spectra
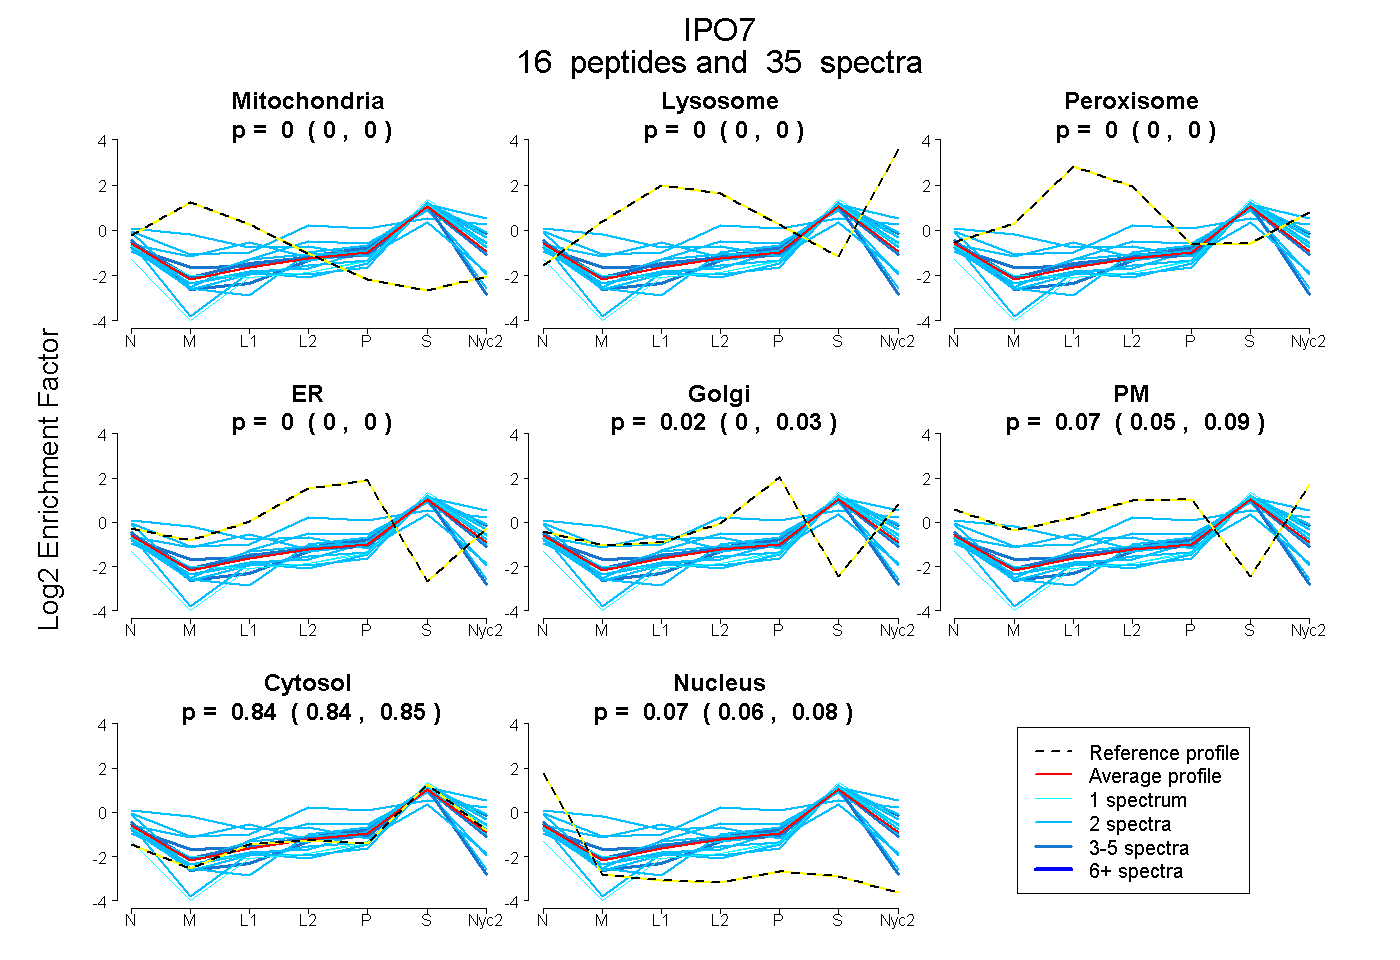
0.000 | 0.000
0.000 | 0.000
0.000 | 0.000
0.000 | 0.001
0.000 | 0.033
0.048 | 0.087
0.837 | 0.848
0.063 | 0.076
5peptides
spectra
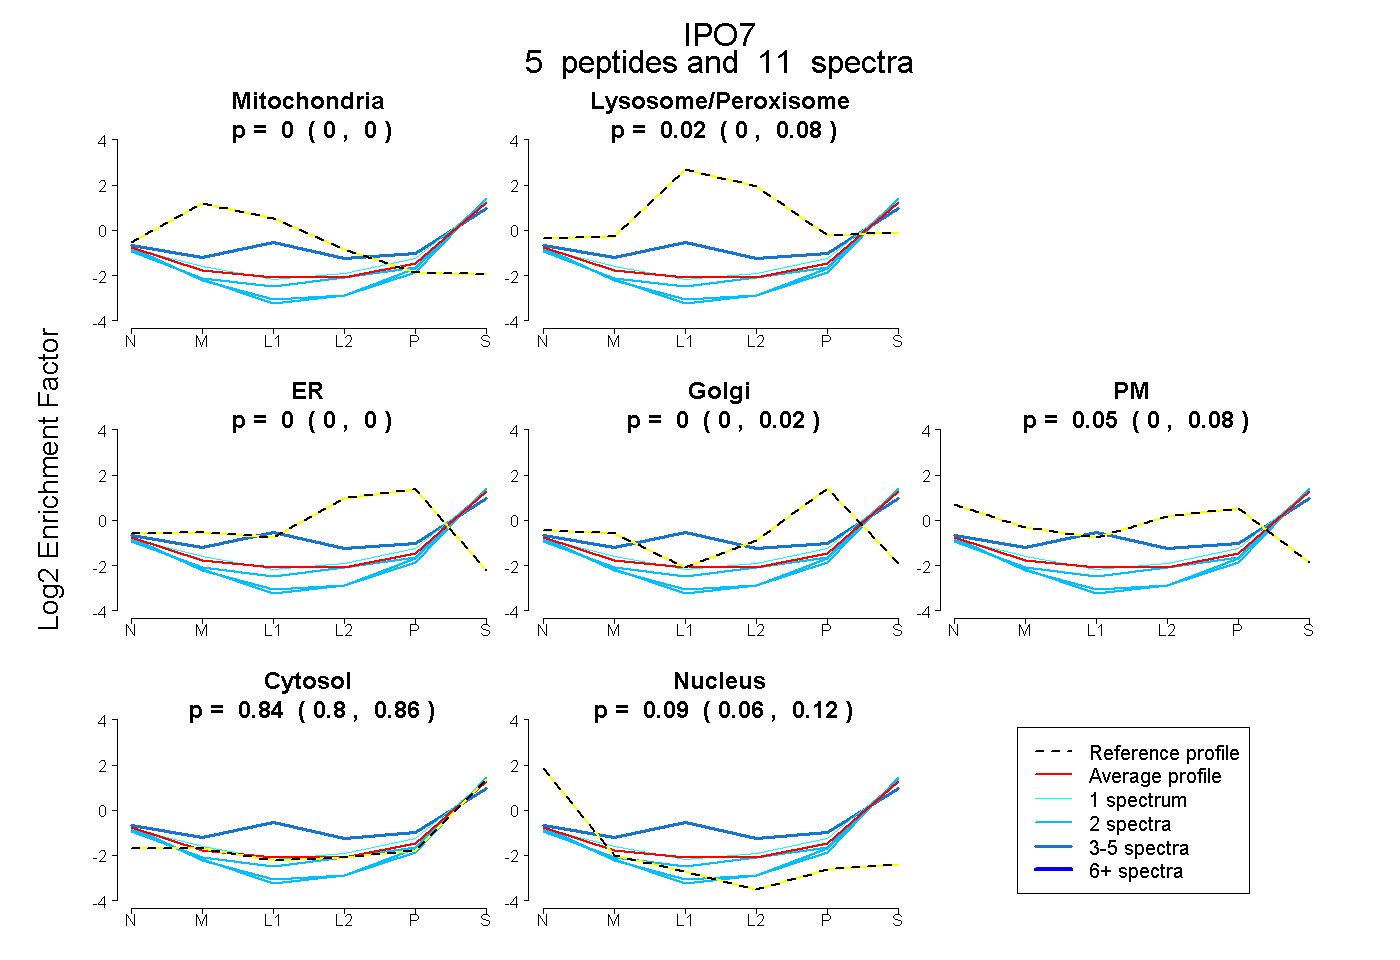
0.000 | 0.000
0.000 | 0.079
0.000 | 0.000
0.000 | 0.016
0.000 | 0.080
0.804 | 0.859
0.063 | 0.122
8peptides
spectra
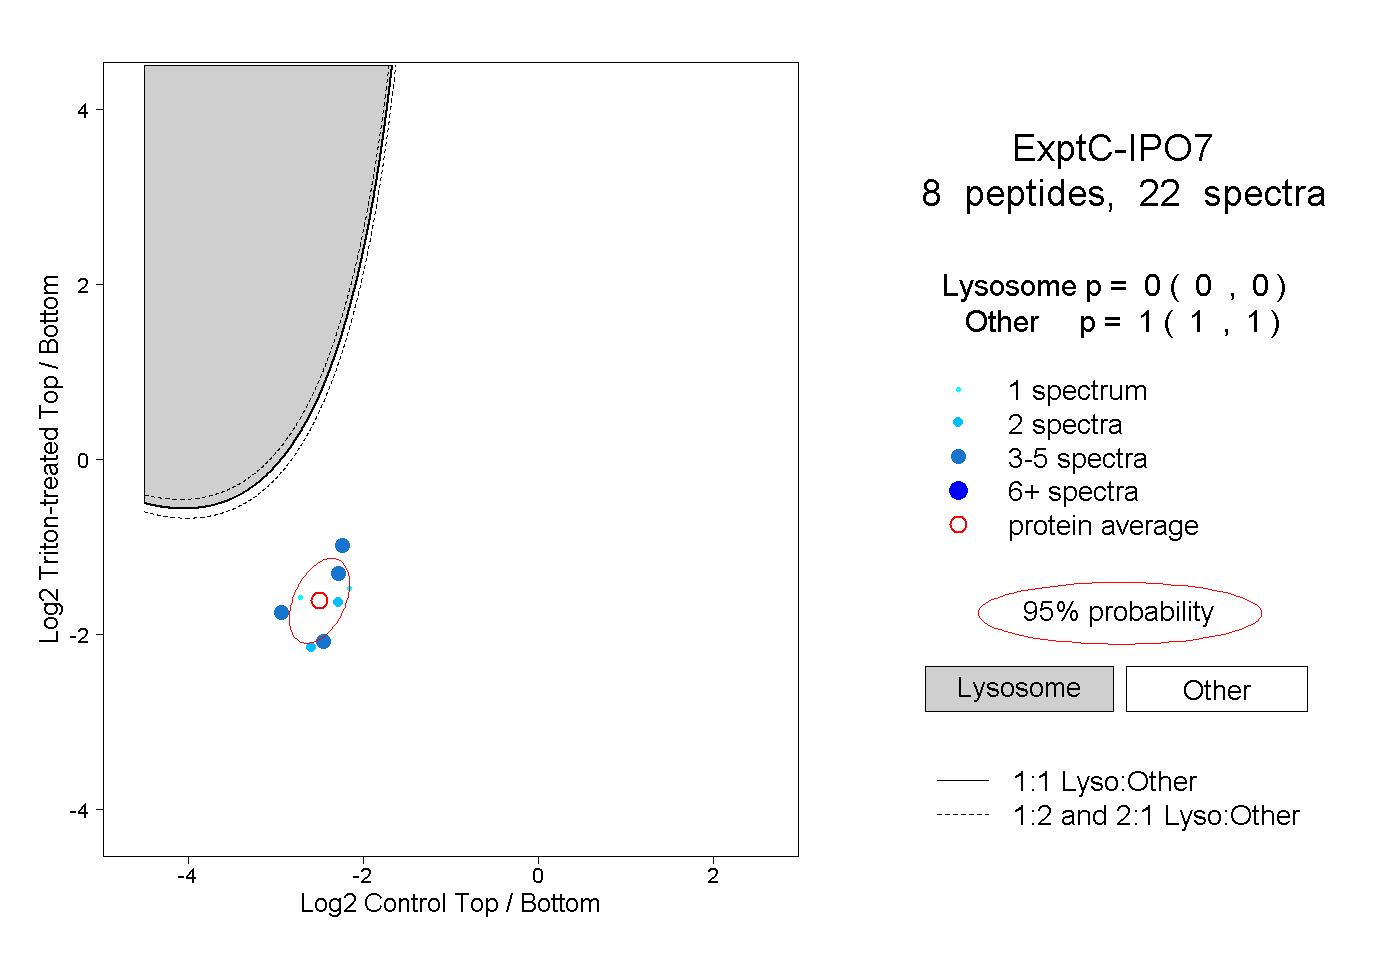
0.000 | 0.000
1.000 | 1.000